Review
. 2005 Jan 28;307(5709):538-44.
doi: 10.1126/science.1104274.

Quantum dots for live cells, in vivo imaging, and diagnostics

Affiliations
Review

Quantum dots for live cells, in vivo imaging, and diagnostics

X Michalet et al. Science. .

Abstract

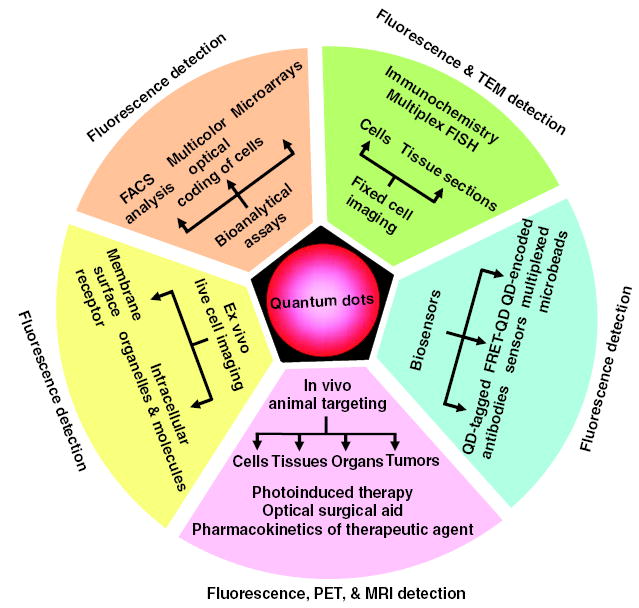
Research on fluorescent semiconductor nanocrystals (also known as quantum dots or qdots) has evolved over the past two decades from electronic materials science to biological applications. We review current approaches to the synthesis, solubilization, and functionalization of qdots and their applications to cell and animal biology. Recent examples of their experimental use include the observation of diffusion of individual glycine receptors in living neurons and the identification of lymph nodes in live animals by near-infrared emission during surgery. The new generations of qdots have far-reaching potential for the study of intracellular processes at the single-molecule level, high-resolution cellular imaging, long-term in vivo observation of cell trafficking, tumor targeting, and diagnostics.


Figures

Fig. 1
Fig. 1
(A) Emission maxima and sizes of quantum dots of different composition. Quantum dots can be synthesized from various types of semiconductor materials (II-VI: CdS, CdSe, CdTe. . .; III-V: InP, InAs . . .; IV-VI: PbSe. . .) characterized by different bulk band gap energies. The curves represent experimental data from the literature on the dependence of peak emission wavelength on qdot diameter. The range of emission wavelength is 400 to 1350 nm, with size varying from 2 to 9.5 nm (organic passivation/solubilization layer not included). All spectra are typically around 30 to 50 nm (full width at half maximum). Inset: Representative emission spectra for some materials. Data are from (, , , –82). Data for CdHgTe/ZnS have been extrapolated to the maximum emission wavelength obtained in our group. (B) Absorption (upper curves) and emission (lower curves) spectra of four CdSe/ZnS qdot samples. The blue vertical line indicates the 488-nm line of an argon-ion laser, which can be used to efficiently excite all four types of qdots simultaneously. [Adapted from (28)] (C) Size comparison of qdots and comparable objects. FITC, fluorescein isothiocyanate; GFP, green fluorescent protein; qdot, green (4 nm, top) and red (6.5 nm, bottom) CdSe/ZnS qdot; qrod, rod-shaped qdot (size from Quantum Dot Corp.’s Web site). Three proteins—streptavidin (SAV), maltose binding protein (MBP), and immunoglobulin G (IgG)—have been used for further functionalization of qdots (see text) and add to the final size of the qdot, in conjunction with the solubilization chemistry (Fig. 2).
Fig. 2
Fig. 2
Qdot solubilization and functionalization. (A) Surface chemistries. TOPO (trioctylphosphine oxide)–passivated qdots can be solubilized in aqueous buffer by addition of a layer of amphiphilic molecules containing hydrophilic (w+) and hydrophobic (w–) moieties, or by exchange of TOPO with molecules that have a Zn-coordinating end (usually a thiol group, SH) and a hydrophilic end. Examples of addition include (a) formation of a cross-linked polymer shell (31), (b) coating with a layer of amphiphilic triblock copolymer (26), and (c) encapsulation in phospholipid micelles (29). Examples of exchange include (d) mercaptoacetic acid (MAA) (20), (e) dithiothreitol (DTT) (21), (f) dihydrolipoic acid (DHLA) (33), (g) oligomeric phosphines (22), (h) cross-linked dendrons (23), and (i) peptides (24). The curved arrow indicates sites available for further functionalization. (B) Peptide toolkit. The light blue segment contains cysteines and hydrophobic amino acids ensuring binding to the qdot (24) and is common to all peptides. S, solubilization sequence; P, PEG; B, biotin; R, peptide recognition sequence; Q, quencher; D, DOTA; X, any unspecified peptide-encoded function. Qdot solubilization is obtained by a mixture of S and P. Qdots can be targeted with B, R, or other chemical moieties. Qdot fluorescence can be turned on or off by attaching a Q via a cleavable peptide link. In the presence of the appropriate enzyme, the quencher is separated from the qdot, restoring the photoluminescence and reporting on the enzyme activity. For simultaneous PET and fluorescence imaging, qdots can be rendered radioactive by D chelation of radionuclides; for simultaneous MRI and fluorescence imaging, qdots can be rendered radioactive by D chelation of nuclear spin labels.
Fig. 3
Fig. 3
Single-particle tracking in a live cell. The brightness and photostability of qdots permit single qdot observation over a long period of time. Live HeLa cells stably transfected with a plasmid expressing a chimeric avidin-CD14 receptor (24) were grown on fibronectin-coated glass coverslips, incubated with biotin-qdots (emission 630 nm), and washed with the observation medium. The cells were observed by differential interference contrast (DIC) (A) and epifluorescence (B) on an inverted microscope (Axiovert 100, Zeiss) with a simple Hg lamp and imaged with a cooled monochrome charge-coupled device camera (CoolSnap HQ, Roper Scientific). Single qdots were observed to diffuse at characteristically different rates in different regions of the membrane or inside the cytosol (data not shown). (C) The 1000-step (100 ms/step) trajectory, R(t), of the qdot localized in the region marked in (A) and (B). (D) The corresponding qdot intensity, I(t). The blinking pattern (succession of on and off emission) demonstrates that a single qdot was observed.
Fig. 4
Fig. 4
Animal use of qdots. (A and B) microPET and fluorescence imaging of qdots. Qdots having DOTA (a chelator used for radiolabeling) and 600-dalton PEG on their surface were radiolabeled with 64Cu (positron-emitting isotope with half-life of 12.7 hours). These qdots were then injected via the tail vein into nude mice (~80 μCi per animal) and imaged in a small animal scanner. (A) Rapid and marked accumulation of qdots in the liver quickly follows their intravenous injection in normal adult nude mice. This could be avoided by functionalizing qdots with higher molecular weight PEG chains, as other studies have shown (49). (B) Overlay of DIC and fluorescence images of hepatocytes from a mouse shows the accumulation of qdots within liver cells. Scale bar, 20 μm. A further step could involve TEM imaging of the precise localization of qdots in cells, illustrating the potential of qdots as probes at the macro-, micro-, and nanoscales. (C) Surgical use of NIR qdots. A mouse was injected intradermally with 10 pmol of NIR qdots in the left paw, 5 min after reinjection with 1% isosulfan blue and exposure of the actual sentinel lymph node. Left, color video; right, NIR fluorescence image. Isosulfan blue and NIR qdots were localized in the same lymph node (arrows). Copyright 2004 Nature Publishing Group. Reproduced with permission from (60).
Fig. 5
Fig. 5
Applications of quantum dots as multimodal contrast agents in bioimaging.

References

    1. Michalet X, et al. Annu Rev Biophys Biomol Struct. 2003;32:161. - PubMed
    1. Special issue on Biological Imaging, Science300, 75 (2003).
    1. Weiss S. Science. 1999;283:1676. - PubMed
    1. Alivisatos AP. Science. 1996;271:933.
    1. Efros AL, Rosen M. Annu Rev Mater Sci. 2000;30:475.

Publication types

Substances