

Role of nucleotides immediately flanking the transcription-regulating sequence core in coronavirus subgenomic mRNA synthesis
- PMID: 15681451
- PMCID: PMC546574
- DOI: 10.1128/JVI.79.4.2506-2516.2005
Role of nucleotides immediately flanking the transcription-regulating sequence core in coronavirus subgenomic mRNA synthesis
Abstract
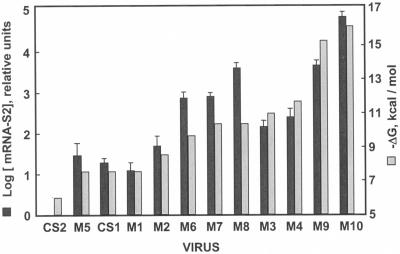
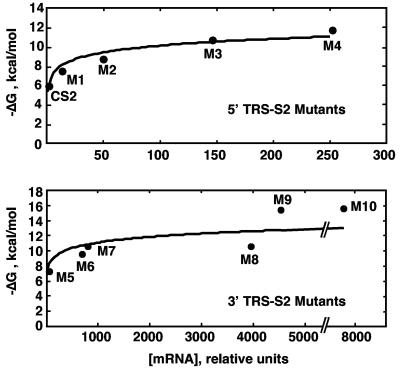
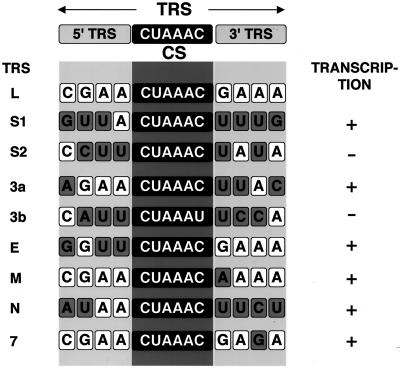
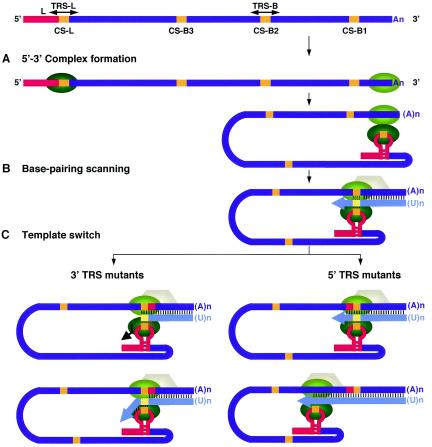
The generation of subgenomic mRNAs in coronavirus involves a discontinuous mechanism of transcription by which the common leader sequence, derived from the genome 5' terminus, is fused to the 5' end of the mRNA coding sequence (body). Transcription-regulating sequences (TRSs) precede each gene and include a conserved core sequence (CS) surrounded by relatively variable sequences (5' TRS and 3' TRS). Regulation of transcription in coronaviruses has been studied by reverse-genetics analysis of the sequences immediately flanking a unique CS in the Transmissible gastroenteritis virus genome (CS-S2), located inside the S gene, that does not lead to detectable amounts of the corresponding mRNA, in spite of its canonical sequence. The transcriptional inactivity of CS-S2 was genome position independent. The presence of a canonical CS was not sufficient to drive transcription, but subgenomic synthesis requires a minimum base pairing between the leader TRS (TRS-L) and the complement of the body TRS (cTRS-B) provided by the CS and its adjacent nucleotides. A good correlation was observed between the free energy of TRS-L and cTRS-B duplex formation and the levels of subgenomic mRNA S2, demonstrating that base pairing between the leader and body beyond the CS is a determinant regulation factor in coronavirus transcription. In TRS mutants with increasing complementarity between TRS-L and cTRS-B, a tendency to reach a plateau in DeltaG values was observed, suggesting that a more precise definition of the TRS limits might be proposed, specifically that it consists of the central CS and around 4 nucleotides flanking 5' and 3' the CS. Sequences downstream of the CS exert a stronger influence on the template-switching decision according to a model of polymerase strand transfer and template switching during minus-strand synthesis.
Figures
Similar articles
-
Sequence motifs involved in the regulation of discontinuous coronavirus subgenomic RNA synthesis.J Virol. 2004 Jan;78(2):980-94. doi: 10.1128/jvi.78.2.980-994.2004. J Virol. 2004. PMID: 14694129 Free PMC article.
-
Transcription regulatory sequences and mRNA expression levels in the coronavirus transmissible gastroenteritis virus.J Virol. 2002 Feb;76(3):1293-308. doi: 10.1128/jvi.76.3.1293-1308.2002. J Virol. 2002. PMID: 11773405 Free PMC article.
-
Identification of a coronavirus transcription enhancer.J Virol. 2008 Apr;82(8):3882-93. doi: 10.1128/JVI.02622-07. Epub 2008 Feb 13. J Virol. 2008. PMID: 18272586 Free PMC article.
-
Coronaviruses use discontinuous extension for synthesis of subgenome-length negative strands.Adv Exp Med Biol. 1995;380:499-506. doi: 10.1007/978-1-4615-1899-0_79. Adv Exp Med Biol. 1995. PMID: 8830530 Review.
-
A new model for coronavirus transcription.Adv Exp Med Biol. 1998;440:215-9. doi: 10.1007/978-1-4615-5331-1_26. Adv Exp Med Biol. 1998. PMID: 9782283 Review.
Cited by
-
A multicomponent RNA-based control system regulates subgenomic mRNA transcription in a tombusvirus.J Virol. 2007 Mar;81(5):2429-39. doi: 10.1128/JVI.01969-06. Epub 2006 Dec 13. J Virol. 2007. PMID: 17166897 Free PMC article.
-
Origin, evolution, and genotyping of emergent porcine epidemic diarrhea virus strains in the United States.mBio. 2013 Oct 15;4(5):e00737-13. doi: 10.1128/mBio.00737-13. mBio. 2013. PMID: 24129257 Free PMC article.
-
High temporal resolution Nanopore sequencing dataset of SARS-CoV-2 and host cell RNAs.Gigascience. 2022 Oct 17;11:giac094. doi: 10.1093/gigascience/giac094. Gigascience. 2022. PMID: 36251275 Free PMC article.
-
A U-turn motif-containing stem-loop in the coronavirus 5' untranslated region plays a functional role in replication.RNA. 2007 May;13(5):763-80. doi: 10.1261/rna.261807. Epub 2007 Mar 12. RNA. 2007. PMID: 17353353 Free PMC article.
-
Rewiring the severe acute respiratory syndrome coronavirus (SARS-CoV) transcription circuit: engineering a recombination-resistant genome.Proc Natl Acad Sci U S A. 2006 Aug 15;103(33):12546-51. doi: 10.1073/pnas.0605438103. Epub 2006 Aug 4. Proc Natl Acad Sci U S A. 2006. PMID: 16891412 Free PMC article.
References
-
- Choi, K. S., P.-Y. Huang, and M. C. C. Lai. 2002. Polypyrimidine-tract-binding protein affects transcription but not translation of mouse hepatitis virus RNA. Virology 303:58-68. - PubMed
Publication types
MeSH terms
Substances
LinkOut - more resources
Full Text Sources
