

Reliability and reproducibility of gene expression measurements using amplified RNA from laser-microdissected primary breast tissue with oligonucleotide arrays
- PMID: 15681475
- PMCID: PMC1867505
- DOI: 10.1016/S1525-1578(10)60009-8
Reliability and reproducibility of gene expression measurements using amplified RNA from laser-microdissected primary breast tissue with oligonucleotide arrays
Abstract
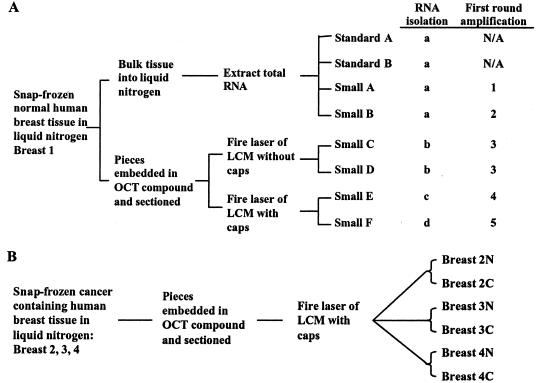
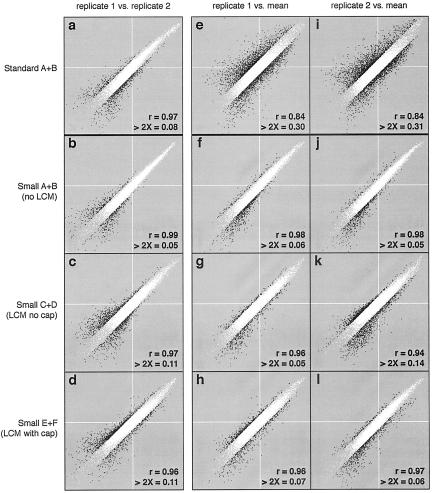
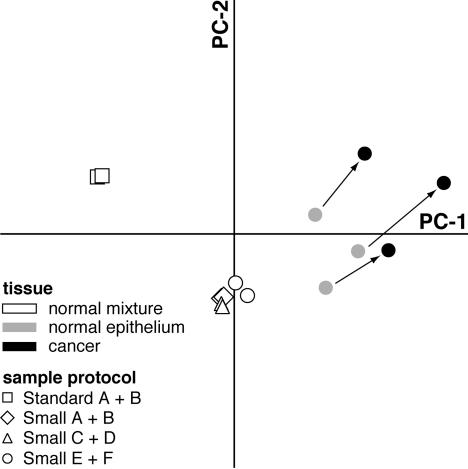
Combined use of microdissection and high-density oligonucleotide arrays is a powerful technique to study in vivo gene expression. Because microdissection generally yields ng quantities of RNA, RNA amplification is necessary but affects array results. We tested the reliability and reproducibility of oligonucleotide array data obtained from small sample amplified RNA isolated from primary tissues via laser capture microdissection, to determine whether gene expression measurements obtained under these now customary conditions are reliable and reproducible enough to detect authentic expression differences between clinical samples. We performed eight U133A Affymetrix GeneChip oligonucleotide array hybridizations using RNA isolated from a single normal human breast specimen: two standard and six small samples prepared using independent microdissections, RNA isolations, and amplifications. We then performed six array hybridizations using RNA obtained similarly from paired normal epithelium and ductal carcinoma in situ from three independent breast specimens. We determined reliability by analysis of hybridization quality metrics, and reproducibility by analysis of the number of more than twofold changed genes, linear regression, and principal components analysis. All amplified RNA generated good quality hybridizations. From the initial specimen, correlations between replicates (r = 0.96 to 0.99) and between small samples (r = 0.94 to 0.98) were high, and between standard and small samples (r = 0.84) were moderate. In contrast, in the three normal cancer pairs, the differences in gene expression were large among the normal samples, the ductal carcinoma in situ samples, and between normal and ductal carcinoma in situ within each pair. These differences were a much larger source of variability than the technical variability introduced by the processes of laser capture microdissection, small sample amplification, and array hybridization. Nanogram quantities of RNA isolated from primary tissue using laser-capture microdissection generates reliable and reproducible gene expression measurements. These measurements do not mirror those obtained using micrograms of RNA. Biological variability in gene expression between independent specimens, and between histologically distinct samples within a specimen, is greater than the technical variability associated with the procedures. Future studies of in vivo gene expression using this approach will identify functionally important differences within or between specimens.
Figures
Similar articles
-
Expression profiling of ductal carcinoma in situ by laser capture microdissection and high-density oligonucleotide arrays.Am J Pathol. 2001 Jun;158(6):2005-10. doi: 10.1016/S0002-9440(10)64672-X. Am J Pathol. 2001. PMID: 11395378 Free PMC article.
-
Establishment of a protocol for the gene expression analysis of laser microdissected rat kidney samples with affymetrix genechips.Toxicol Appl Pharmacol. 2006 Nov 15;217(1):134-42. doi: 10.1016/j.taap.2006.07.012. Epub 2006 Aug 8. Toxicol Appl Pharmacol. 2006. PMID: 16962625
-
Accurate and reproducible gene expression profiles from laser capture microdissection, transcript amplification, and high density oligonucleotide microarray analysis.J Mol Diagn. 2003 Feb;5(1):9-14. doi: 10.1016/S1525-1578(10)60445-X. J Mol Diagn. 2003. PMID: 12552074 Free PMC article.
-
Gene expression profiling of primary tumor cell populations using laser capture microdissection, RNA transcript amplification, and GeneChip microarrays.Methods Mol Biol. 2005;293:187-207. doi: 10.1385/1-59259-853-6:187. Methods Mol Biol. 2005. PMID: 16028420 Review.
-
Correlating purity by microdissection with gene expression in gastric cancer tissue.Scand J Clin Lab Invest. 2007;67(4):367-79. doi: 10.1080/00365510601046334. Scand J Clin Lab Invest. 2007. PMID: 17558891 Review.
Cited by
-
Functional genomics of a generalist parasitic plant: laser microdissection of host-parasite interface reveals host-specific patterns of parasite gene expression.BMC Plant Biol. 2013 Jan 9;13:9. doi: 10.1186/1471-2229-13-9. BMC Plant Biol. 2013. PMID: 23302495 Free PMC article.
-
CDKN1C/p57kip2 is a candidate tumor suppressor gene in human breast cancer.BMC Cancer. 2008 Mar 6;8:68. doi: 10.1186/1471-2407-8-68. BMC Cancer. 2008. PMID: 18325103 Free PMC article.
-
Global array-based transcriptomics from minimal input RNA utilising an optimal RNA isolation process combined with SPIA cDNA probes.PLoS One. 2011 Mar 22;6(3):e17625. doi: 10.1371/journal.pone.0017625. PLoS One. 2011. PMID: 21445340 Free PMC article.
-
Long Non-coding RNA Expression Profiling Using Arraystar LncRNA Microarrays.Methods Mol Biol. 2021;2372:53-74. doi: 10.1007/978-1-0716-1697-0_7. Methods Mol Biol. 2021. PMID: 34417743
-
Exploratory methods for checking quality of microarray data.Bioinformation. 2007 Apr 10;1(10):423-8. doi: 10.6026/97320630001423. Bioinformation. 2007. PMID: 17597933 Free PMC article.
References
-
- Leethanakul C, Patel V, Gillespie J, Pallente M, Ensley JF, Koontongkaew S, Liotta LA, Emmert-Buck M, Gutkind JS. Distinct pattern of expression of differentiation and growth-related genes in squamous cell carcinomas of the head and neck revealed by the use of laser capture microdissection and cDNA arrays. Oncogene. 2000;19:3220–3224. - PubMed
-
- Luo L, Salunga RC, Guo H, Bittner A, Joy KC, Galindo JE, Xiao H, Rogers KE, Wan JS, Jackson MR, Erlander MG. Gene expression profiles of laser-captured adjacent neuronal subtypes. Nat Med. 1999;5:117–122. - PubMed
-
- Ma X-J, Salunga R, Tuggle JT, Gaudet J, Enright E, McQuary P, Payette T, Pistone M, Stecker K, Zhang BM, Zhou Y-X, Varnholt H, Smith B, Gadd M, Chatfield E, Kessler J, Baer TM, Erlander MG, Sgroi DC. Gene expression profiles of human breast cancer progression. Proc Natl Acad Sci USA. 2003;100:5974–5979. - PMC - PubMed
Publication types
MeSH terms
Substances
Grants and funding
LinkOut - more resources
Full Text Sources
Medical
