

A multidisciplinary evaluation of the effectiveness of cyclosporine a in dystrophic mdx mice
- PMID: 15681831
- PMCID: PMC1602333
- DOI: 10.1016/S0002-9440(10)62270-5
A multidisciplinary evaluation of the effectiveness of cyclosporine a in dystrophic mdx mice
Abstract
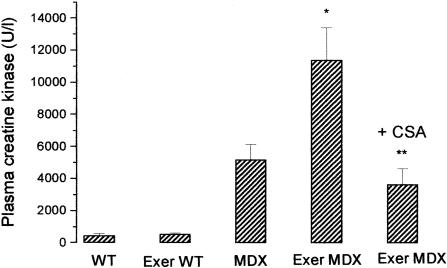
Chronic inflammation is a secondary reaction of Duchenne muscular dystrophy and may contribute to disease progression. To examine whether immunosuppressant therapies could benefit dystrophic patients, we analyzed the effects of cyclosporine A (CsA) on a dystrophic mouse model. Mdx mice were treated with 10 mg/kg of CsA for 4 to 8 weeks throughout a period of exercise on treadmill, a protocol that worsens the dystrophic condition. The CsA treatment fully prevented the 60% drop of forelimb strength induced by exercise. A significant amelioration (P < 0.05) was observed in histological profile of CsA-treated gastrocnemius muscle with reductions of nonmuscle area (20%), centronucleated fibers (12%), and degenerating area (50%) compared to untreated exercised mdx mice. Consequently, the percentage of normal fibers increased from 26 to 35% in CsA-treated mice. Decreases in creatine kinase and markers of fibrosis were also observed. By electrophysiological recordings ex vivo, we found that CsA counteracted the decrease in chloride conductance (gCl), a functional index of degeneration in diaphragm and extensor digitorum longus muscle fibers. However, electrophysiology and fura-2 calcium imaging did not show any amelioration of calcium homeostasis in extensor digitorum longus muscle fibers. No significant effect was observed on utrophin levels in diaphragm muscle. Our data show that the CsA treatment significantly normalized many functional, histological, and biochemical endpoints by acting on events that are independent or downstream of calcium homeostasis. The beneficial effect of CsA may involve different targets, reinforcing the usefulness of immunosuppressant drugs in muscular dystrophy.
Figures


Similar articles
-
First evaluation of the potential effectiveness in muscular dystrophy of a novel chimeric compound, BN 82270, acting as calpain-inhibitor and anti-oxidant.Neuromuscul Disord. 2006 Apr;16(4):237-48. doi: 10.1016/j.nmd.2006.01.013. Epub 2006 Mar 15. Neuromuscul Disord. 2006. PMID: 16542837
-
Role of tumour necrosis factor alpha, but not of cyclo-oxygenase-2-derived eicosanoids, on functional and morphological indices of dystrophic progression in mdx mice: a pharmacological approach.Neuropathol Appl Neurobiol. 2007 Jun;33(3):344-59. doi: 10.1111/j.1365-2990.2007.00798.x. Neuropathol Appl Neurobiol. 2007. PMID: 17493014
-
Multiple pathological events in exercised dystrophic mdx mice are targeted by pentoxifylline: outcome of a large array of in vivo and ex vivo tests.J Appl Physiol (1985). 2009 Apr;106(4):1311-24. doi: 10.1152/japplphysiol.90985.2008. Epub 2009 Jan 8. J Appl Physiol (1985). 2009. PMID: 19131478
-
Enhanced dystrophic progression in mdx mice by exercise and beneficial effects of taurine and insulin-like growth factor-1.J Pharmacol Exp Ther. 2003 Jan;304(1):453-63. doi: 10.1124/jpet.102.041343. J Pharmacol Exp Ther. 2003. PMID: 12490622
-
Muscle disorders associated with cyclosporine treatment.Muscle Nerve. 1999 Dec;22(12):1631-6. doi: 10.1002/(sici)1097-4598(199912)22:12<1631::aid-mus3>3.0.co;2-v. Muscle Nerve. 1999. PMID: 10567074
Cited by
-
Muscular dystrophy: Experimental animal models and therapeutic approaches (Review).Exp Ther Med. 2021 Jun;21(6):610. doi: 10.3892/etm.2021.10042. Epub 2021 Apr 14. Exp Ther Med. 2021. PMID: 33936267 Free PMC article. Review.
-
Alteration of STIM1/Orai1-Mediated SOCE in Skeletal Muscle: Impact in Genetic Muscle Diseases and Beyond.Cells. 2021 Oct 12;10(10):2722. doi: 10.3390/cells10102722. Cells. 2021. PMID: 34685702 Free PMC article. Review.
-
Degenerative and regenerative features of myofibers differ among skeletal muscles in a murine model of muscular dystrophy.J Muscle Res Cell Motil. 2016 Oct;37(4-5):153-164. doi: 10.1007/s10974-016-9452-6. Epub 2016 Jul 29. J Muscle Res Cell Motil. 2016. PMID: 27472930
-
Zidovudine ameliorates pathology in the mouse model of Duchenne muscular dystrophy via P2RX7 purinoceptor antagonism.Acta Neuropathol Commun. 2018 Apr 11;6(1):27. doi: 10.1186/s40478-018-0530-4. Acta Neuropathol Commun. 2018. PMID: 29642926 Free PMC article.
-
Preclinical drug trials in the mdx mouse: assessment of reliable and sensitive outcome measures.Muscle Nerve. 2009 May;39(5):591-602. doi: 10.1002/mus.21211. Muscle Nerve. 2009. PMID: 19260102 Free PMC article.
References
-
- Hoffman EP, Dressman D. Molecular pathophysiology and targeted therapeutics for muscular dystrophy. Trends Pharmacol Sci. 2001;22:465–470. - PubMed
-
- Alderton JM, Steinhardt RA. How calcium influx through calcium leak channels is responsible for the elevated levels of calcium-dependent proteolysis in dystrophic myotubes. Trends Cardiovasc Med. 2000;10:268–272. - PubMed
Publication types
MeSH terms
Substances
LinkOut - more resources
Full Text Sources
Other Literature Sources
Medical
Molecular Biology Databases
