Comparative Study
. 2005 Mar 14;483(3):278-91.
doi: 10.1002/cne.20416.

Nitric oxide stimulates gamma-aminobutyric acid release and inhibits glycine release in retina

Affiliations
Comparative Study

Nitric oxide stimulates gamma-aminobutyric acid release and inhibits glycine release in retina

Dou Yu et al. J Comp Neurol. .

Abstract

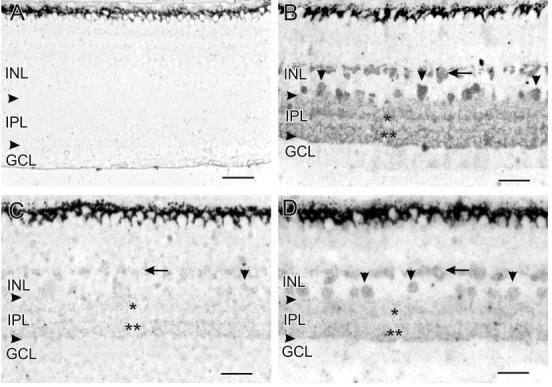
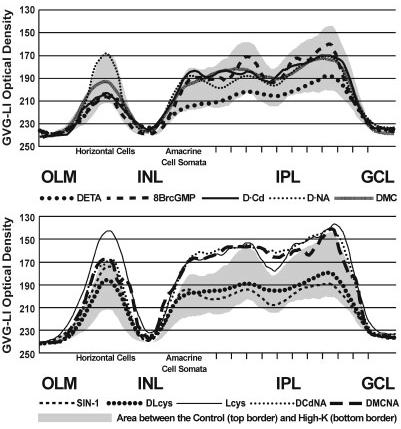
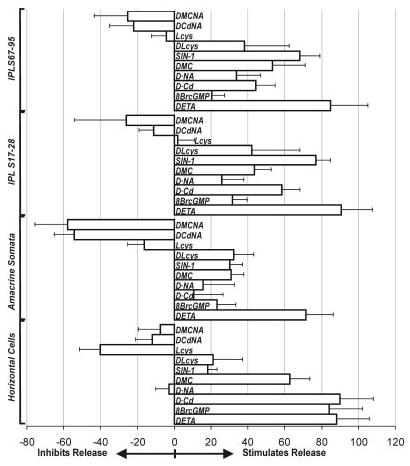
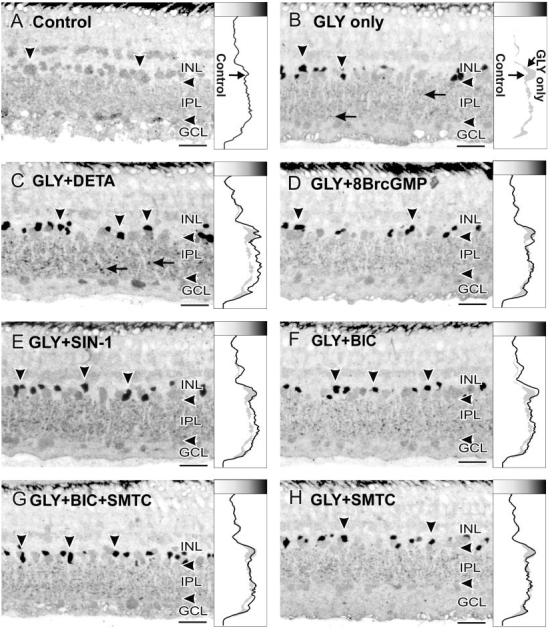
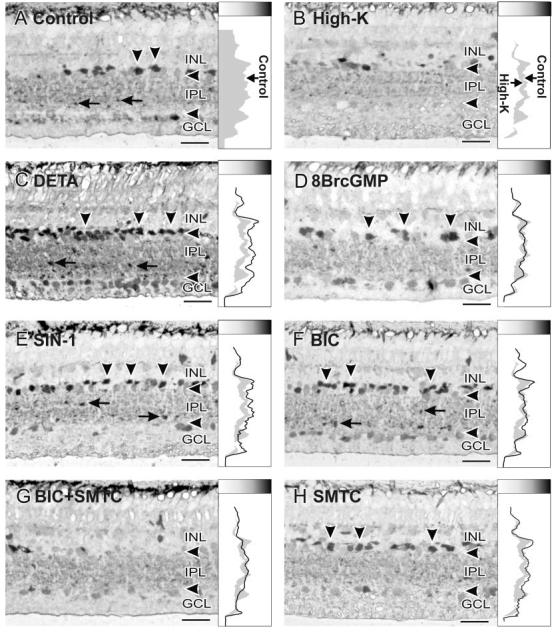
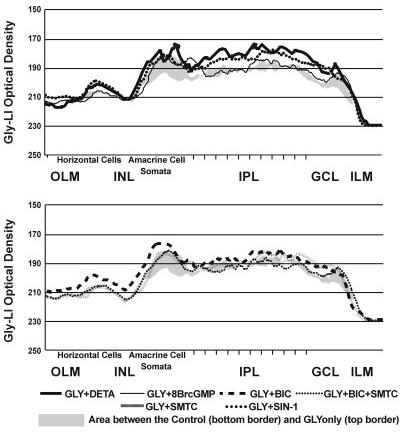
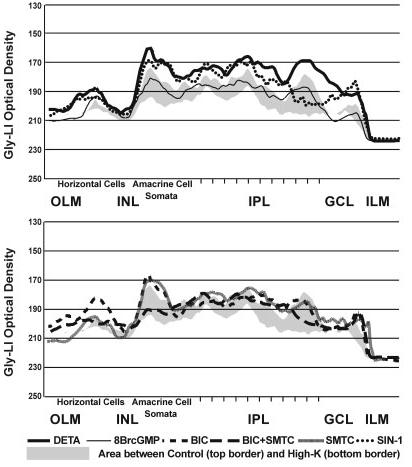
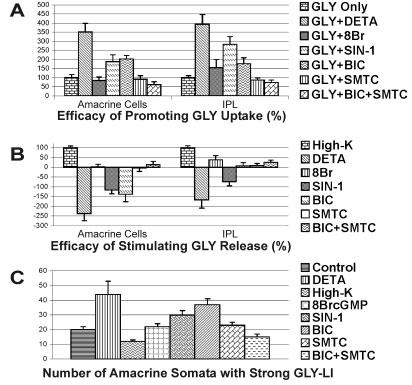
Nitric oxide (NO) modulates the uptake and/or release of neurotransmitters through a variety of cellular mechanisms. However, the pharmacological and biochemical processes underlying these neurochemical effects of NO often remain unclear. In our study, we used immunocytochemical methods to study the effects of NO, cyclic guanosine monophosphate (cGMP), and peroxynitrite on the uptake and release of gamma-aminobutyric acid (GABA) and glycine in the turtle retina. In addition, we examined the involvement of glutamate receptors, calcium, and the GABA transporter in this GABA uptake and release. We also tested for interactions between the GABAergic and glycinergic systems. In general, we show that NO stimulated GABA release and inhibited glycine release. The NO-stimulated GABA release involved calcium-dependent or calcium-independent synaptic release or reversal of the GABA transporter. Some effects of NO on GABA release involved glutamate, cGMP, or peroxynitrite. NO promoted glycine uptake and inhibited its release, and this inhibition of glycine release was influenced by GABAergic modulation. These findings indicate that NO modulates the levels of the inhibitory transmitters GABA and glycine through several specific biochemical mechanisms in different retinal cell types and layers. Thus it appears that some of the previously described reciprocal interactions between GABA and glycine in the retina function through specific NO signaling pathways.


Figures

Fig. 1
Fig. 1
The horizontal arrowheads in Figures 1, 2, 5, and 6 indicate the borders of the IPL. In this figure and Figure 2, the localization of GVG-LI is indicated as follows: horizontal cells (horizontal arrows), amacrine cell somata (vertical arrowheads), S17-S28 of the IPL (single asterisks), and S67-S95 of the IPL (double asterisks). A: Without loading with GVG, there was no endogenous GVG-LI anywhere in the retina. B: Loading with 5 mM GVG for 60 minutes dramatically increased GVG-LI in the retina, showing labeling patterns that match those of GABA. H1 horizontal cells, amacrine cell somata, and labeled bands within the IPL are clearly visible. Probably due to the thin sections used in our study, the GABAergic bands at S17 and S28 appear as one thick band, and the GABAergic bands at S67, S84, and S95 also appear as one continuous band with elevated GVG-LI. C: Loading with GVG in the presence of 100 μM DETA for 60 minutes dramatically prevented an increase in GVG-LI. There was virtually no GVG-LI in horizontal cells and only extremely faint GVG-LI in some amacrine cell somata and the IPL. D: Incubating retinas with 100 μM DETA for 30 minutes after loading with GVG dramatically reduced the levels of GVG-LI in horizontal cells, amacrine cell somata, and bands formed by processes in the IPL. For abbreviations, see list. Scale bars = 25 μm.
Fig. 2
Fig. 2
In this plate, a corresponding line profile curve box is attached to the right side of each image. These line profile curves were generated by scanning and averaging the optical density of GVG-LI in a comparable region of 10 retinal samples from the same treatment. Higher levels of GVG-LI are indicated to the right and as darker shades in the shade gradient box beneath the line profile curves. All retinas were preloaded with GVG prior to the pharmacological treatments. A: Retinas loaded with GVG that were left in normal BSS were used as controls. The levels of GVG-LI were high in horizontal cells, in amacrine cell somata, in S17-S28 of the IPL, and in S67-S95 of the IPL. The line profile curve of this treatment is shown as the right border of the gray shading throughout this figure. B: In High-K treated retinas, the GVG-LI was dramatically reduced. This line profile curve is presented as the left borderline of the gray shading throughout this figure. C: Retinas treated with 100 μM DETA showed similar effects to High-K, with reduced GVG-LI in all layers. This line profile curve is presented as a dark line. The same indications of the control, High-K, and the specific pharmacological treatment as a dark line are used for all the subsequent panels in this figure. D: Treatment with 100 μM 8BrcGMP simulated the effects of either DETA or High-K in the outer retina by producing a dramatic reduction in GVG-LI in the horizontal cells. The other retinal layers only showed slight decreases in GVG-LI. E: Removal of external Ca2+ and replacing it with Cd2+ (D·Cd) reduced the effects of DETA in the IPL, producing only moderate decreases in the levels of GVG-LI. There was still a strong DETA-stimulated decrease in GVG-LI in the outer retina. F: NA (100 μM) blocked the effects of DETA in the outer retina and reduced the effects of DETA in the IPL. G: The combination of Cd2+ and NA effectively blocked the effects of DETA in all retinal layers. H: MK801 and CNQX reduced part of the DETA stimulated release in all layers. I: Combining NA with MK801 and CNQX (100 μM each) eliminated the DETA-stimulated release in all retinal layers. J: SIN-1 (100 μM) mimicked the effects of DETA in the inner retina but failed to do so in the outer retina. K: The ONOO- scavenger Lcys (100 μM) reduced a portion of the DETA-stimulated release in the inner and outer retina, indicating that some DETA effects were acting through ONOO-L: Lcys alone slightly increased the GVG-LI in the horizontal cells whereas it appeared to have little effect in the other retinal layers. For abbreviations, see list. Scale bars = 25 μm.
Fig. 3
Fig. 3
Mechanisms of NO-stimulated GVG release. The line profile curve averages for the GVG release experiments are presented together to show the differences between the various treatments in specific retinal layers. The line profile curve of the control is shown as the top border of the gray shading, and the line profile curve for the High-K treatment is shown as the bottom border of the gray shading. For abbreviations, see list.
Fig. 4
Fig. 4
The efficacy of a given treatment in stimulating GVG release from specific retinal layers was calculated based on the peak values (PVs) from each treatment. The PVs were measured, and their average differences from the control were compared against the difference between the control and the High-K stimulation, which was considered as 100% release. For abbreviations, see list.
Fig. 5
Fig. 5
Glycine uptake experiments. In this figure and Figure 6, the vertical arrowheads indicate amacrine cell somata with GVG-LI, and the horizontal arrows indicate labeled boutons in the IPL. Higher GLY-LI levels are indicated to the right and as darker shades in the shade gradient box on top of the line profile curves. A: Retinas incubated with 5 mM sarcosine for 180 minutes were used as controls. Little GLY-LI was present after this treatment, and the line profile curve shows the background levels of GLY-LI. B: Reloading with GLY (1 mM) for 30 minutes dramatically increased GLY-LI in amacrine cell somata and in boutons in the IPL. The line profile curve shows increased levels of GLY-LI in the amacrine cell somata and in the IPL (right border of the gray shading in the curve box). C: Loading with GLY in the presence of 100 μM DETA increased the GLY-LI in the IPL and in amacrine cell somata in comparison with GLY loading only. D: Loading with GLY in the presence of 100 μM 8BrcGMP, however, did not mimic the effects of DETA, with the line profile curve roughly matching that seen with GLY loading only. E: Loading with GLY in the presence of 100 μM SIN-1 also raised GLY-LI above the levels seen with loading GLY alone, but more prominently in the IPL. F: Loading with GLY in the presence of 100 μM BIC mimicked the effects of DETA or SIN-1, with increased GLY-LI in amacrine cell somata and in the IPL, but the levels of increase in the IPL were not as great as those seen with DETA or SIN-1. G: Combining 100 μM SMTC with BIC, however, reduced the effects of BIC alone. H: SMTC alone did not enhance the loading of GLY. For abbreviations, see list. Scale bars = 25 μm.
Fig. 6
Fig. 6
Glycine release experiments. A: Retinas loaded with 1 mM GLY for 180 minutes were used as a control, and showed strong GLY-LI in both amacrine cell somata and boutons in the IPL. This control line profile curve is presented as the right borderline of the gray shading. Higher GLY-LI levels are indicated toward the right and as darker shades in the shade gradient box on top of the line profile curves. In B-H, all retinas were treated as follows after being loaded with 1 mM GLY for 180 minutes. B: High-K stimulation dramatically reduced the levels of GLY-LI, and the line profile curve is shown as the left borderline of the gray shading. C: DETA (100 μM) dramatically increased the levels of GLY-LI in amacrine cell somata, in somata in the GCL, and in boutons in the IPL, leading to significantly higher numbers of labeled amacrine cell somata than in the controls. D: Treatment with 100 M 8BrcGMP did not mimic the effects of DETA, showing a line profile curve more similar to that of the controls. E: SIN-1 (100 M) mimicked some effects of DETA in that the GLY-LI levels were raised in both amacrine cell somata and in boutons in the IPL, but not in somata in the GCL. F: BIC (100 M) also increased GLY-LI in amacrine cell somata and in some boutons in the IPL. G: Adding 100 M SMTC to 100 M BIC reduced the GLY-LI in amacrine cell somata, in somata in the GCL, and in some boutons in the IPL, in comparison with BIC alone. H: SMTC itself had little effect on GLY-LI, showing a similar line profile curve to that of the control. For abbreviations, see list. Scale bars 25 μ m.
Fig. 7
Fig. 7
The line profile curves for the GLY uptake experiments are presented together to show the differences between the treatments in specific retinal layers. The line profile curve of the unloaded control is shown as the bottom border of the gray shading, and the line profile curve for the GLY-loading is shown as the top border of the gray shading. For abbreviations, see list.
Fig. 8
Fig. 8
The line profile curves for the GLY release experiments are presented together to show the differences between the treatments in specific retinal layers. The line profile curve of the untreated but GVG-loaded control is shown as the top border of the gray shading, and the line profile curve for the High-K treatment is shown as the bottom border of the gray shading. For abbreviations, see list.
Fig. 9
Fig. 9
The area-under-the-curve (AUC) values for the amacrine cell somata and the IPL of the GLY-LI line profile curves. A: The efficacy of treatments in promoting GLY uptake were calculated based on the comparison of the difference in the GLY-LI AUC between untreated control retinas (0% uptake) and the retinas loaded with GLY (100% uptake); B: The efficacy in stimulating GLY release was calculated based on the comparison of the AUC difference between the GLY-loaded control retinas (0% release) and High-K-stimulated retinas (100% release); C: The amacrine cell somata count reflects the number of somata with strong GLY-LI in the INL seen with each treatment. The somata counts were obtained from images of retina that were matched in terms of their retinal location and the length of retina analyzed. For abbreviations, see list.

Similar articles

Cited by

References

    1. Ahern GP, Hsu SF, Klyachko VA, Jackson MB. Induction of persistent sodium current by exogenous and endogenous nitric oxide. J Biol Chem. 2000;275:28810–28815. - PubMed
    1. Baldridge WH, Fischer AJ. Nitric oxide donor stimulated increase of cyclic GMP in the goldfish retina. Vis Neurosci. 2001;18:849–856. - PubMed
    1. Bauer ML, Beckman JS, Bridges RJ, Fuller CM, Matalon S. Peroxynitrite inhibits sodium uptake in rat colonic membrane vesicles. Biochim Biophys Acta. 1992;1104:87–94. - PubMed
    1. Beckman JS, Koppenol WH. Nitric oxide, superoxide, and peroxynitrite: the good, the bad, and the ugly. Am J Physiol. 1996;271:1424–1437. - PubMed
    1. Blute TA, Mayer B, Eldred WD. Immunocytochemical and histochemical localization of nitric oxide synthase in the turtle retina. Vis Neurosci. 1997;14:717–729. - PubMed

Publication types

MeSH terms

Substances