

Normal photoresponses and altered b-wave responses to APB in the mdx(Cv3) mouse isolated retina ERG supports role for dystrophin in synaptic transmission
- PMID: 15683561
- PMCID: PMC1482463
- DOI: 10.1017/S0952523804215085
Normal photoresponses and altered b-wave responses to APB in the mdx(Cv3) mouse isolated retina ERG supports role for dystrophin in synaptic transmission
Abstract
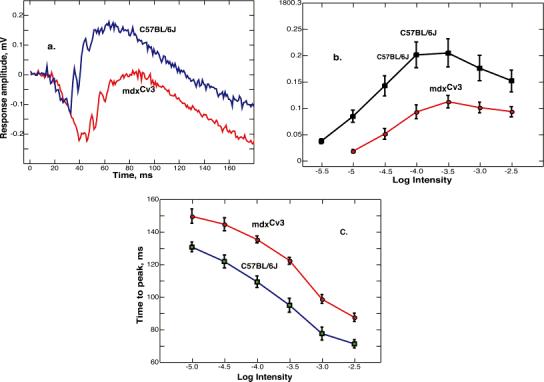
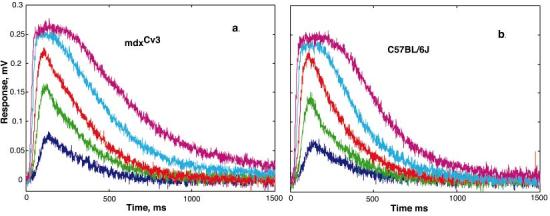
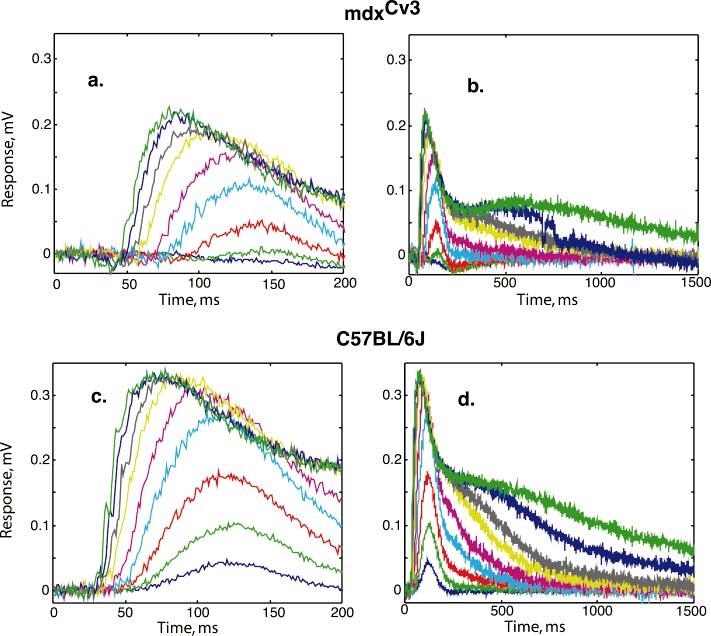
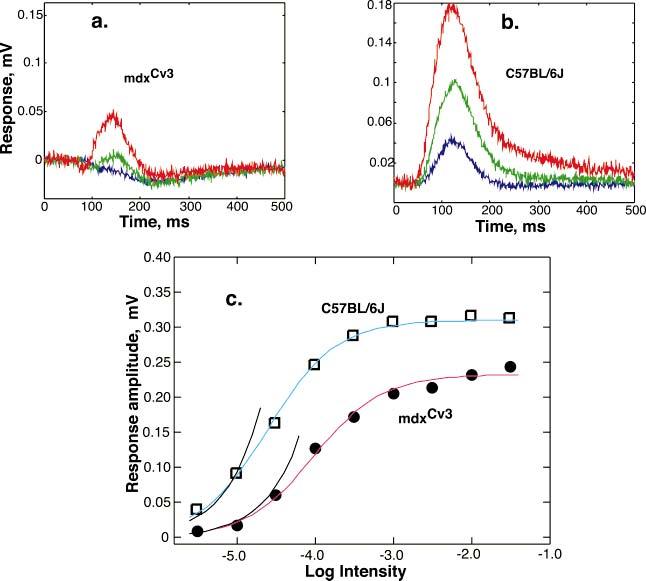
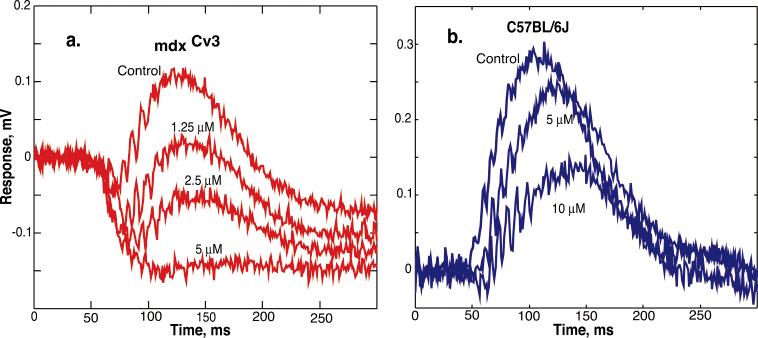
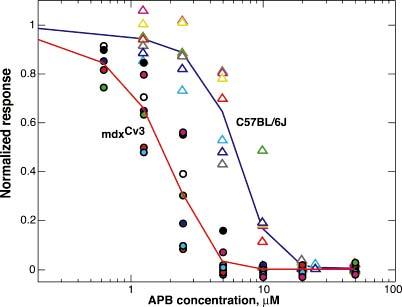
The mdx(Cv3) mouse is a model for Duchenne muscular dystrophy (DMD). DMD is an X-linked disorder with defective expression of the protein dystrophin, and which is associated with a reduced b-wave and has other electro- retinogram (ERG) abnormalities. To assess potential causes for the abnormalities, we recorded ERGs from pieces of isolated C57BL/6J and mdx(Cv3) mouse retinas, including measurements of transretinal and intraretinal potentials. The ERGs from the isolated mdx(Cv3) retina differ from those of control retinas in that they show reduced b-wave amplitudes and increased b-wave implicit times. Photovoltages obtained by recording across the photoreceptor outer segments of the retinas did not differ from normal, suggesting that the likely causes of the reduced b-wave are localized to the photoreceptor to ON-bipolar synapse. At a concentration of 50 microM, the glutamate analog dl-2-amino-4-phosphonobutyric acid (APB) blocks the b-wave component of the ERG, by binding to sites on the postsynaptic membrane. The On-bipolar cell contribution to the ERG was inferred by extracting the component that was blocked by APB. We found that this component was smaller in amplitude and had longer response latencies in the mdx(Cv3) mice, but was of similar overall time course. To assess the sensitivity of sites on the postsynaptic membrane to glutamate, the concentration of APB in the media was systematically varied, and the magnitude of blockage of the light response was quantified. We found that the mdx(Cv3) retina was 5-fold more sensitive to APB than control retinas. The ability of lower concentrations of APB to block the b-wave in mdx(Cv3) suggests that the ERG abnormalities may reflect alterations in either glutamate release, the glutamate postsynaptic binding sites, or in other proteins that modulate glutamate function in ON-bipolar cells.
Figures
Similar articles
-
Effects of dystrophin isoforms on signal transduction through neural retina: genotype-phenotype analysis of duchenne muscular dystrophy mouse mutants.Mol Genet Metab. 1999 Feb;66(2):100-10. doi: 10.1006/mgme.1998.2784. Mol Genet Metab. 1999. PMID: 10068512
-
A dissection of the electroretinogram from the isolated rat retina with microelectrodes and drugs.Vis Neurosci. 1999 Jul-Aug;16(4):727-41. doi: 10.1017/s0952523899164125. Vis Neurosci. 1999. PMID: 10431921
-
Primate photopic sine-wave flicker ERG: vector modeling analysis of component origins using glutamate analogs.Invest Ophthalmol Vis Sci. 2001 Jan;42(1):305-12. Invest Ophthalmol Vis Sci. 2001. PMID: 11133883
-
Slight alteration of the electroretinogram in mice lacking dystrophin dp71.Ophthalmic Res. 2014;51(4):196-203. doi: 10.1159/000357272. Epub 2014 Mar 22. Ophthalmic Res. 2014. PMID: 24662427
-
Comparisons of structural and functional abnormalities in mouse b-wave mutants.J Physiol. 2008 Sep 15;586(18):4385-92. doi: 10.1113/jphysiol.2008.159327. Epub 2008 Jul 24. J Physiol. 2008. PMID: 18653656 Free PMC article. Review.
Cited by
-
Intra-retinal visual cycle required for rapid and complete cone dark adaptation.Nat Neurosci. 2009 Mar;12(3):295-302. doi: 10.1038/nn.2258. Epub 2009 Feb 1. Nat Neurosci. 2009. PMID: 19182795 Free PMC article.
-
Longer lasting electroretinographic recordings from the isolated and superfused murine retina.Graefes Arch Clin Exp Ophthalmol. 2009 Oct;247(10):1339-52. doi: 10.1007/s00417-009-1119-1. Epub 2009 Jul 23. Graefes Arch Clin Exp Ophthalmol. 2009. PMID: 19629513
-
Retinal Phenotyping of a Murine Model of Lafora Disease.Genes (Basel). 2023 Mar 31;14(4):854. doi: 10.3390/genes14040854. Genes (Basel). 2023. PMID: 37107612 Free PMC article.
-
Dystrophin is required for appropriate retrograde control of neurotransmitter release at the Drosophila neuromuscular junction.J Neurosci. 2006 Jan 4;26(1):333-44. doi: 10.1523/JNEUROSCI.4069-05.2006. J Neurosci. 2006. PMID: 16399704 Free PMC article.
-
Retinal ON bipolar cells express a new PCP2 splice variant that accelerates the light response.J Neurosci. 2008 Sep 3;28(36):8873-84. doi: 10.1523/JNEUROSCI.0812-08.2008. J Neurosci. 2008. PMID: 18768681 Free PMC article.
References
-
- AHN AH, KUNKEL LM. The structural and functional diversity of dystrophin. Nature Genetics. 1993;3:283–291. - PubMed
-
- BLANK M, KOULEN P, BLAKE DJ, KROGER S. Dystrophin and beta-dystroglycan in photoreceptor terminals from normal and mdx3Cv mouse retinae. European Journal of Neuroscience. 1999;11:2121–2133. - PubMed
-
- BOLLMANN JH, SAKMANN B, BORST JG. Calcium sensitivity of glutamate release in a calyx-type terminal. Science. 2000;289:953–957. - PubMed
Publication types
MeSH terms
Substances
Grants and funding
LinkOut - more resources
Full Text Sources
Miscellaneous
