. 2004 Sep-Oct;21(5):791-805.
doi: 10.1017/S0952523804215127.

Gap junctional regulatory mechanisms in the AII amacrine cell of the rabbit retina

Affiliations

Gap junctional regulatory mechanisms in the AII amacrine cell of the rabbit retina

Xiao-Bo Xia et al. Vis Neurosci. 2004 Sep-Oct.

Abstract

Gap junctions are commonplace in retina, often between cells of the same morphological type, but sometimes linking different cell types. The strength of coupling between cells derives from the properties of the connexins, but also is regulated by the intracellular environment of each cell. We measured the relative coupling of two different gap junctions made by AII amacrine cells of the rabbit retina. Permeability to the tracer Neurobiotin was measured at different concentrations of the neuromodulators dopamine, nitric oxide, or cyclic adenosine monophosphate (cAMP) analogs. Diffusion coefficients were calculated separately for the gap junctions between pairs of AII amacrine cells and for those connecting AII amacrine cells with ON cone bipolar cells. Increased dopamine caused diffusion rates to decline more rapidly across the AII-AII gap junctions than across the AII-bipolar cell gap junctions. The rate of decline at these sites was well fit by a model proposing that dopamine modulates two independent gates in AII-AII channels, but only a single gate on the AII side of the AII-bipolar channel. However, a membrane-permeant cAMP agonist modulated both types of channel equally. Therefore, the major regulator of channel closure in this network is the local cAMP concentration within each cell, as regulated by dopamine, rather than different cAMP sensitivity of their respective gates. In contrast, nitric oxide preferentially reduced AII-bipolar cell permeabilities. Coupling from AII amacrine cells to the different bipolar cell subtypes was differentially affected by dopamine, indicating that light adaptation acting via dopamine release alters network coupling properties in multiple ways.


Figures
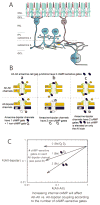
Fig. 1
Fig. 1
(A) AII amacrine cells (AII) relay input from rod bipolar cells (RB) to cone bipolar cells, which then contact ganglion cells (GC). Each AII amacrine cell makes gap junctions both with neighboring AII amacrine cells and with a variety of ON cone bipolar cells (ON CB). (B) Three models of gap junctional gating in the AII–ON cone bipolar cell circuit. Gap junctions between neighboring AII amacrine cells are assumed to use a single connexin type and are closed by elevations in cAMP in each model. The models differ in their view of the AII–bipolar cell channels. In (Ba), the AII–bipolar cell channel consists of an AII hemichannel with a cAMP-sensitive gate identical to that between pairs of AIIs, while the bipolar cell hemichannel is insensitive to cAMP. In (Bb), both the AII and bipolar cell hemichannels are insensitive to cAMP. In (Bc), both AII and bipolar cell hemichannels are sensitive to cAMP. Therefore, the models predict two cAMP-sensitive gates between pairs of AIIs, and 0, 1, or 2 cAMP-sensitive gates between the AII and ON cone bipolar cells. For convenience, gates are depicted as directly modulated by local cAMP binding, but modulation is almost certainly indirect via protein kinases. Each hemichannel is drawn as if comprised of a single connexin type, although this relationship is neither proven nor obligatory for the models. (C) These models predict that the permeability changes in response to elevations in cAMP must be a function of the number of cAMP-sensitive gates in the AII–ON cone bipolar cell channels. The ks are diffusion coefficients (cell separations2/s), plotted arbitrarily on these axes.
Fig. 2
Fig. 2
(A & B) Injection of Neurobiotin into an AII amacrine cell stains many neighboring AII amacrine cells (red), and also stains many ON cone bipolar cells (blue). Dopamine reduces AII–AII coupling, thereby producing smaller stained groups (B) than in retina not exposed to dopamine (A). (C & D) The fluorescent intensity of the somas stained following injection of Neurobiotin into an AII amacrine cell declines as a function of distance from the injected cell, but more rapidly for dopamine-treated retinas (D) than in control (C) retinas. The lines are the best fit of a model which uniquely determines diffusion coefficients between the AII–AII pairs (red points and line) and between AII’s and the population of bipolar cells (blue triangles; blue lines predict the range). For visual clarity, only one-third of the data points, randomly selected, are shown. (E) Tracer injected into an AII amacrine cell (left, with pipette) diffuses into distant AII cells through a series of AII–AII gap junctions. By contrast, tracer in a bipolar cell must have diffused through a series of AII–AII gap junctions, and also through a single AII–ON cone bipolar cell gap junction. (F) The effect of reducing gap junctional permeabilities in the two different pathways reflects the model in (E). Tracer concentration in AII amacrine cells (red line) and bipolar cells (whose range is shown by blue lines) is plotted as a function of distance from the injected cell. Reducing AII–AII permeability only (middle panel) increases the rate of decline for both AII and bipolar cells, as tracer must traverse the same number of AII–AII gap junctions for either cell type at any given distance. Bipolar cell staining is further reduced by the constraint of crossing the AII–bipolar cell gap junction, but remains the same fixed decrement as in the left panel. Reducing AII–bipolar cell permeability only (right panel) leaves the decline in AII amacrine cell brightness almost unchanged, but bipolar cell intensities decrease proportionately to the reduction in AII–bipolar cell coupling.
Fig. 3
Fig. 3
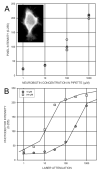
HeLa cells filled by diffusion of known concentrations of Neurobiotin from a patch pipette were imaged on a confocal microscope. (A) The photodetector intensity increased with increasing concentration of Neurobiotin in the pipette. The inset shows an example of a HeLa cell filled and imaged in this manner. (B) The brightness of HeLa cells at each Neurobiotin concentration was measured at different laser attenuation settings of the confocal microscope. The resulting function could be shifted to also fit the brightness values of HeLa cells with a different Neurobiotin concentration.
Fig. 4
Fig. 4
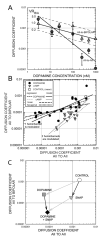
Exogenous dopamine lowered the diffusion coefficient (cell separations2/s) for both gap junctional pathways. (A) As dopamine concentration was increased, the diffusion coefficient from AII amacrine cells to bipolar cells (triangles) was reduced less than that between pairs of AIIs (circles). Values shown are mean + 1 S.E.M. To test the effect of volume differences between the compartments, diffusion coefficients were calculated with volume ratio VRB/A that ranged from 0.2 to 5.0. These regression lines are shown for kAB for volume ratios of 0.2, 1.0, and 5.0, and the data for 1.0. Differing volumes do not significantly change the slope of the functions. The AII–AII diffusion coefficients changed only marginally because their relative volume was set to 1.0, and are therefore not shown. (B) The model of Fig. 1Ba predicts that the diffusion coefficient from AIIs to ON cone bipolar cell (ordinate) will decline at half the diffusion coefficient found between pairs of AIIs (abscissa), consistent with cAMP action at two gates/channel for AII–AII coupling, as opposed to only one at channels from AIIs to bipolar cells. The dark solid line is the prediction of this model. The dark dashed line is the least-squares regression to the data and lies close to the model prediction. However, the membrane-permeant cAMP analog, Sp-8-CPT-cAMPS produced data (triangles) that is fit by the dashed gray regression line and the model prediction of slope 1 (solid gray line), as would be produced by an equal decline in both diffusion coefficients. This indicates equal cAMP sensitivity at each site and suggests that differential modulation is not based upon differences in the types of gates on the two types of channel. The dotted lines are the predictions of the hexagonal model. Although the slopes were less, the overall findings were quite similar. (C) The nitric oxide donor SNAP produced significant changes in AII–bipolar coupling, but not in AII–AII coupling, either when administered alone, or in combination with 500 nM dopamine.
Fig. 5
Fig. 5
(A) Some bipolar cells stained from injection of an AII amacrine cell are immunopositive for CaBP (light and dark asterisks). Other bipolar cells of similar intensity but CaBP-negative can be found throughout the field. This image was inverted in intensity. (B & D) In control experiments (B), CaBP-positive bipolar cells (light squares) are among the best-stained bipolar cells. There is no difference (solid line) between the upper envelope of CaBP-negative bipolar cells (dark upward triangles) and the CaBP-positive bipolar cells. (D) High levels of dopamine (250 nM—1 μM) reduce the brightness of CaBP-positive bipolar cells (squares) relative to other well-coupled ON cone bipolar cells (upward triangles). AII amacrine cells (circles) and other CaBP-negative bipolar cells (downward triangles) are shown for comparison. (C) The fluorescent intensity of CaBP-positive bipolar cells relative to the brightest CaBP-negative bipolar cells decreases in the presence of high dopamine or cAMP. In contrast, the D1 antagonist SCH23390 slightly elevates CaBP-positive bipolar cell staining relative to other bipolar cells. The nitric oxide donor SNAP had no significant effect on the relative intensities of the bipolar cell subtypes, with or without dopamine. Data is the log10 of the ratio of the mean intensity of the CaBP-positive bipolar cells to the intensity of the brightest CaBP-negative bipolar cells.

Similar articles

Cited by

References

    1. Bloomfield SA, Xin D, Osborne T. Light-induced modulation of coupling between AII amacrine cells in the rabbit retina. Visual Neuroscience. 1997;14:565–576. - PubMed
    1. Chow CC, Kopell N. Dynamics of spiking neurons with electrical coupling. Neural Computation. 2000;12:1643–1678. - PubMed
    1. Cohen E, Sterling P. Demonstration of cell types among cone bipolar neutrons of cat retina. Philosophical Transactions of the Royal Society B (London) 1990;330:305–321. - PubMed
    1. Condorelli DF, Parenti R, Spinella F, Trovato Salinaro A, Belluardo N, Cardile V, Cicirata F. Cloning of a new gap junction gene (Cx36) highly expressed in mammalian brain neurons. European Journal of Neuroscience. 1998;10:1202–1208. - PubMed
    1. Deans MR, Volgyi B, Goodenough DA, Bloomfield SA, Paul DL. Connexin36 is essential for transmission of rod-mediated visual signals in the mammalian retina. Neuron. 2002;36:703–712. - PMC - PubMed

Publication types