. 2005 Jan 31;168(3):375-87.
doi: 10.1083/jcb.200409091.

Chromosome looping in yeast: telomere pairing and coordinated movement reflect anchoring efficiency and territorial organization

Affiliations

Chromosome looping in yeast: telomere pairing and coordinated movement reflect anchoring efficiency and territorial organization

Kerstin Bystricky et al. J Cell Biol. .

Abstract

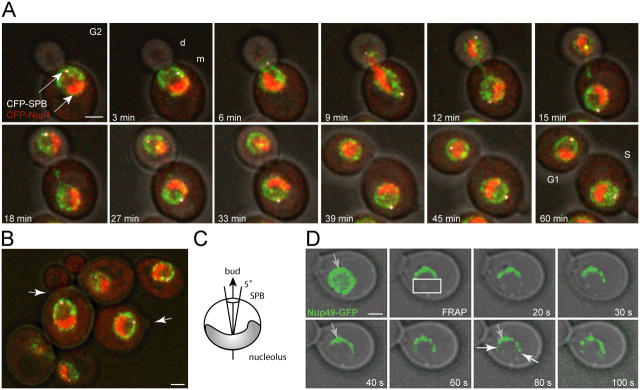
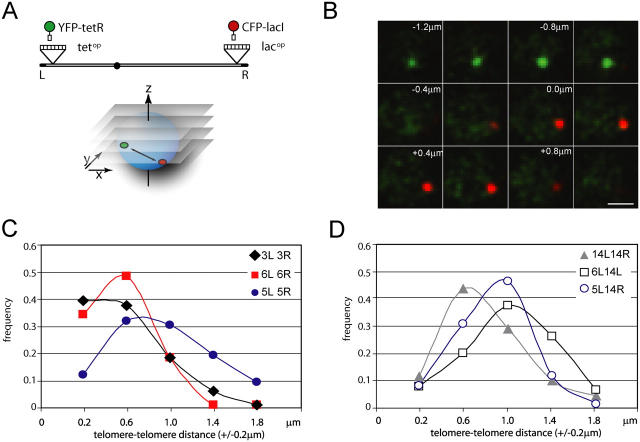
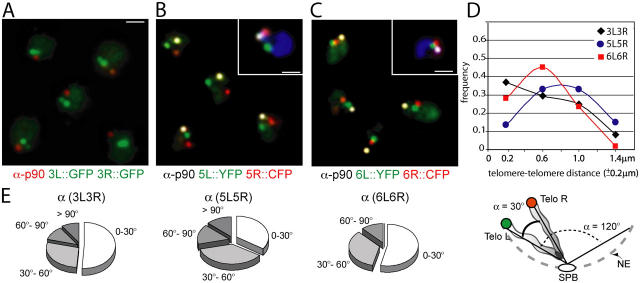
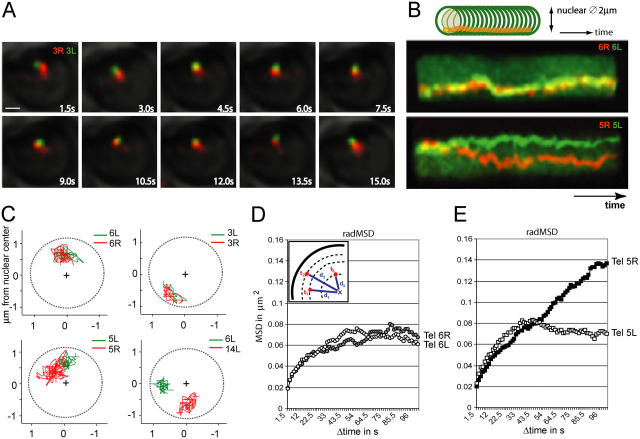
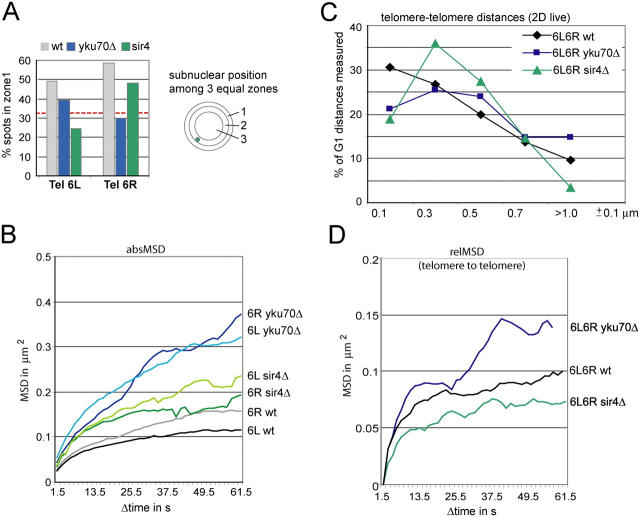
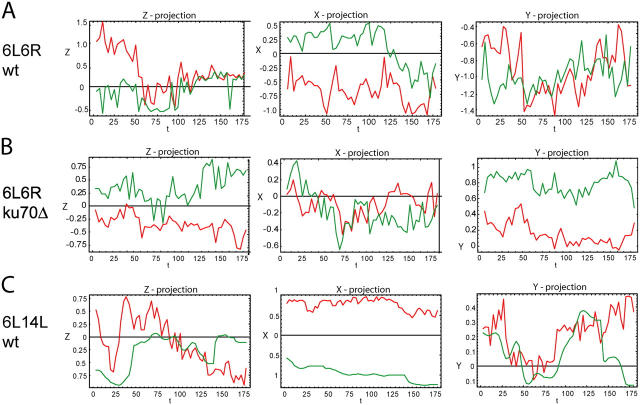
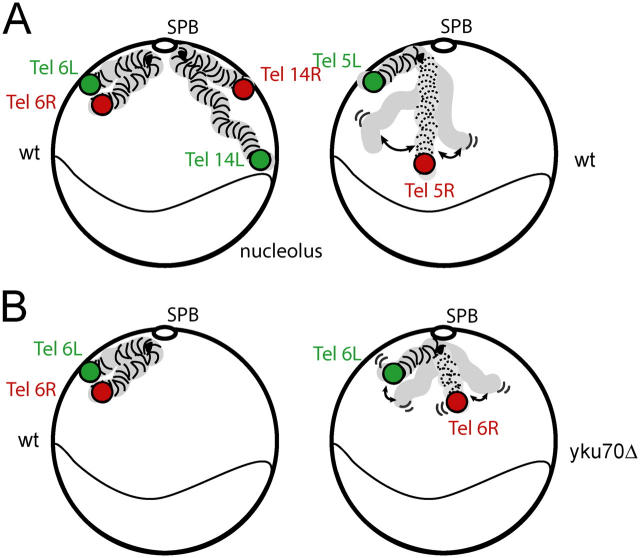
Long-range chromosome organization is known to influence nuclear function. Budding yeast centromeres cluster near the spindle pole body, whereas telomeres are grouped in five to eight perinuclear foci. Using live microscopy, we examine the relative positions of right and left telomeres of several yeast chromosomes. Integrated lac and tet operator arrays are visualized by their respective repressor fused to CFP and YFP in interphase yeast cells. The two ends of chromosomes 3 and 6 interact significantly but transiently, forming whole chromosome loops. For chromosomes 5 and 14, end-to-end interaction is less frequent, yet telomeres are closer to each other than to the centromere, suggesting that yeast chromosomes fold in a Rabl-like conformation. Disruption of telomere anchoring by deletions of YKU70 or SIR4 significantly compromises contact between two linked telomeres. These mutations do not, however, eliminate coordinated movement of telomere (Tel) 6R and Tel6L, which we propose stems from the territorial organization of yeast chromosomes.


Figures

Figure 1.
Figure 1.
The yeast SPB and nucleolus are aligned with the site of bud emergence throughout interphase. (A) Selected frames from a Zeiss LSM510 confocal time-lapse series of GA-2253 yeast cells as they progress through G2, mitosis and G1, show the NE (Nup49, green) and the SPB (white) opposite the crescent-shaped nucleolus (Nop1, red). The CFP-SPB signal was substituted digitally with white to facilitate visualization. See also Video 2. d, daughter cell; m, mother cell. (B) A population of cells tagged as in A, showing the relationship of the nucleolus and SPB to the emerging bud (arrows). (C) Schematic representation of interphase nuclear polarity. (D) GFP-Nup49-labeled pores in G1-phase cells (GA-2197) were bleached (white frame) by confocal laser exposure and epifluorescence/phase images were taken at 10-s intervals thereafter. Pores indicated are either immobile (gray arrows) or slowly diffusing (white arrows). Bars, 1 μm.
Figure 2.
Figure 2.
3D position of telomeres relative to each other in intact cells. (A) CFP-lacI and YFP-tetR fusions allow visualization of the inserted lac op and tet op arrays. (B) Image stacks (x-y planes) of 0.2 μm along the z-axis from the Zeiss LSM510 are shown for Tel 5L (CFP, red) and 5R (YFP, green). Bar, 1 μm. (C and D) Distances between the two telomeres in strains GA-2337 (3R3L), GA-2201 (6L6R), GA-2199 (5L5R), GA-2468 (14L14R), GA-2757 (5L14R) and GA-2202 (6L14L). Images of intact fixed cells were acquired in 3D, typically taking stacks of 12–16 focal planes of 0.2-μm intervals along the z-axis. Distributions of distances are plotted by 0.4-μm categories (±0.2 μm).
Figure 3.
Figure 3.
Chr 3 and Chr 6 form whole chromosome loops. Epi- and IF of G1-arrested haploid cells: (A) GA-2195 (SPB, red; 3L::GFP, green; 3R::GFP, green); (B) GA-2201 (SPB, white; 5L::YFP, green; 5R::CFP, red); (C) GA-2199 (SPB, white; 6L::YFP, green; 6R::CFP, red). An example of four color images with the Nop1 channel in blue is given in the insets of B and C. Bar, 1 μm. Shown are maximal projections of 10 0.25-μm z-sections. (D) Distance frequencies between the two fluorescent markers (in 0.4 μm categories ± 0.2 μm) for the telomere pairs of Chr 3 (black diamonds), Chr 5 (blue circles), and Chr 6 (red squares). (E) Distribution of the angles α calculated by triangulation of the 3D measurements for all individual cells examined in G1 and S-phase cells. Schematic representation of a folded chromosome and intervening angle α between two chromatids.
Figure 4.
Figure 4.
Live imaging of telomere dynamics. A Zeiss LSM510 confocal time-lapse microscopy (2D) was performed on double-tagged Chr 3, 5, 6, and 14 taking frames every 1.5 s, by adjusting the plane of focus when necessary (see time-lapse series as Videos 3–6). (A) Representative sequence of frames taken at 1.5-s intervals in 2D of GA-2337, 3R::CFP (red), 3L::YFP (green). Bar, 1 μm. (B) Telomere tracks over time: 100 sequential images from 2D time-lapse series are displayed orthogonally, rotated such that the time axis (z) is horizontal. Top panel: GA-2201 6L::YFP (green), 6R::CFP (red) and bottom panel: GA-2199, 5L::YFP (green), 5R::CFP (red). TetR-YFP also produces the diffuse green background. (C) Examples of telomere tracks over 100 frames of 2D time-lapse videos after alignment of interpolated nuclear centers (YFP, green; CFP, red). The dotted circle represents an idealized nuclear circumference (Ø = 2 μm). (D) Radial MSD for telomeres 6R and 6L and 5R and 5L obtained using d = distance between one fluorescent telomere spot and the center of the nuclear background fluorescence for each frame as a function of the time interval (inset, for t = 1.5–101.5 s).
Figure 5.
Figure 5.
Looping of short chromosomes correlates with reduced telomere mobility. (A) Absolute MSD calculated using the 2D videos as described in Fig. 4 for telomeres 5R, 5L, 6R, and 6L using d = actual distance from any one time point to all others (see diagram; for t = 1.5–101.5 s) after nuclear alignment. (B) Relative MSD calculated using d = distance between two telomeres at all possible time intervals (see diagram; for t = 1.5–61.5 s), for the indicated pairs of telomeres.
Figure 6.
Figure 6.
Nuclear order is disrupted in the absence of yKu70p or Sir4p. Mobility, telomere–telomere separation, and telomere anchoring of Chr 6 are compared in wild-type, yku70, and sir4 cells. (A) Positions relative to the NE in wt (gray), yku70 (blue), and sir4 (green) strains of GFP tagged telomeres 6L and 6R mapped to zone 1 (as described in Fig. S2 and Table II). The number of G1-phase cells analyzed and the 95% confidence values (P) for the t test between random and test distributions for 6L are: 122, P = 2.5 × 10⁻³ for 6L wt; 81, P = 0.6 for 6L yku70; 57, P = 4.2 × 10⁻⁵ for 6L sir4; for 6R data see Hediger et al. (2002). (B) Absolute MSD was calculated using the 2D videos as described in Figs. 4 and 6 (for t = 1.5–61.5 s). (C) Frequencies of distances from 2D time-lapse series between the two tagged loci are displayed as a function of 0.2-μm intervals (±0.1). (D) Relative MSD calculated using d = distance between telomeres 6R and 6L at all possible time intervals (for t = 1.5–61.5 s).
Figure 7.
Figure 7.
3D and two-color fluorescence time-lapse imaging of telomere dynamics. Time-lapse microscopy in 3D (one 7-plane stack every 3 s) was performed on GA-2201 (A), GA-2805 (B), and GA-2202 (C) as described in Materials and methods. Coordinates of both telomeres are plotted in x, y, and z against time. (A and B) Tel 6L::YFP (green) and Tel 6R::CFP (red) in wt (A) and yku70Δ (B). (C) Tel 6L::YFP (green), Tel 14L::CFP (red).
Figure 8.
Figure 8.
Schematic representation of a Rabl-like chromosome organization in yeast. (A) In wild-type cells, short chromosomes with equal length arms, such as Chr 6 and Chr 3, form loops through telomere interactions. Other chromosomes fold back less rigidly. This is more pronounced when both telomeres are anchored in the NE, which is not the case for Chr 5. (B) Nuclear order is disrupted by deletion of yku70 as the telomeres of Chr 6 detach from the NE and become more mobile.

References

    1. Aragon-Alcaide, L., and A.V. Strunnikov. 2000. Functional dissection of in vivo interchromosome association in Saccharomyces cerevisiae. Nat. Cell Biol. 2:812–818. - PMC - PubMed
    1. Belgareh, N., and V. Doye. 1997. Dynamics of nuclear pore distribution in nucleoporin mutant yeast cells. J. Cell Biol. 136:747–759. - PMC - PubMed
    1. Belmont, A.S. 2001. Visualizing chromosome dynamics with GFP. Trends Cell Biol. 11:250–257. - PubMed
    1. Berg, H. 1993. Random Walks in Biology. Princeton University Press, Princeton, NJ. 164 pp.
    1. Bradnam, K.R., C. Seoighe, P.M. Sharp, and K.H. Wolfe. 1999. G+C content variation along and among Saccharomyces cerevisiae chromosomes. Mol. Biol. Evol. 16:666–675. - PubMed

Publication types

MeSH terms

Substances