. 2005 Feb 8;102(6):1968-73.
doi: 10.1073/pnas.0406993102. Epub 2005 Jan 31.

Neutral microepidemic evolution of bacterial pathogens

Affiliations

Neutral microepidemic evolution of bacterial pathogens

Christophe Fraser et al. Proc Natl Acad Sci U S A. .

Abstract

Understanding bacterial population genetics is vital for interpreting the response of bacterial populations to selection pressures such as antibiotic treatment or vaccines targeted at only a subset of strains. The evolution of transmissible bacteria occurs by mutation and localized recombination and is influenced by epidemiological as well as molecular processes. We demonstrate that the observed population genetic structure of three important human pathogens, Streptococcus pneumoniae, Neisseria meningitidis, and Staphylococcus aureus, can be explained by using a simple evolutionary model that is based on neutral mutational drift, modulated by recombination, and which incorporates the impact of epidemic transmission in local populations. The predictions of this neutral "microepidemic" model are found to closely fit observed genetic relatedness distributions of bacteria sampled from their natural population, and it provides estimates of the relative rate of recombination that agree well with empirical estimates. The analysis suggests the emergence of neutral bacterial population structure from overlapping microepidemics within clustered host populations and provides insight into the nature and size distribution of these clusters. These findings challenge the assumption that strains of bacterial pathogens differ markedly in relative fitness.


Figures

Fig. 1.
Fig. 1.
A neutral multilocus infinite alleles model of bacterial evolution. Schematic illustrating the model for a population of five individuals. The bacterial strain infecting each individual is characterized by two integers that identify the alleles at two loci. At time t, for example, there are two cases of colonization by bacteria of genotype 3-2. At each generation, each individual can infect any other (represented by black arrows). Mutations occur during the transmission step with rate m and are indicated by red asterisks: Each mutation always generates a new allele. Recombination events, occurring with rate r and illustrated by blue dotted arrows, result in an allele being inherited from a random donor. Mutations and recombination events can affect more than one allele in a single step (not shown) and are not exclusive. More generally, the model is defined for i loci in a population of size N. The model is simulated by starting from a single genotype until equilibrium levels of diversity are reached.
Fig. 2.
Fig. 2.
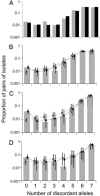
Model fit to data. The allelic mismatch distributions formula image are shown as filled bars for S. pneumoniae (A and B), N. meningitidis (C), and Staphylococcus aureus (D). (A) In the case of S. pneumoniae, two samples were included (Oxford, gray bars; Tampere, Finland, black bars). (B) Weighted mean of the two samples in A. The predictions of the purely neutral model and the neutral microepidemic model are shown fitted to samples as dashed and solid lines, respectively. Maximum likelihood parameter estimates are shown in Table 1. Parameter estimates obtained by fitting to the two pneumococcal studies independently were virtually identical to the joint estimate, reflecting the strong similarity in population structure seen in A. Simulation results are also shown (open circles for the neutral IAM and solid circles for the neutral microepidemic model), along with 95% prediction intervals.
Fig. 3.
Fig. 3.
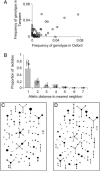
Additional tests of the model. (A) To display differences in content between the two S. pneumoniae samples, we plotted the frequency of each genotype (strain) in each sample. (B) The agreement between simulation and data from the S. pneumoniae sample in Oxford was then examined by using the nearest neighbor distribution, defined as the proportion of isolates whose distance to the most similar nonidentical isolate is k = 1... 7, shown plotted as a function of k. Results from the purely neutral model are shown as open circles, and the neutral microepidemic model results are shown as solid circles. The same distribution was plotted for the three other samples in Fig. 6. Differences in fit between the models are slight, reflecting the fact that the greatest difference is an excess of homozygosity, to which the nearest neighbor analysis is relatively insensitive. We also performed eburst analysis of the Oxford data set (C) and a single realization of the neutral microepidemic model (D) simulated by using parameters from Table 1. Each different strain is represented by a point, the size of which is the frequency of the strain. Strains differing at a single locus, which are inferred to be linked by descent, are joined by lines. A summary of the clustering inferred by eburst is shown in Table 2.
Fig. 4.
Fig. 4.
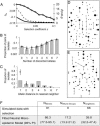
Analysis of a model with hitch-hiking selection. Selection acts upon a single unobserved locus that entirely determines the fitness of a strain. Variation occurs at the same population diversification rates, θ and ρ, as the MLST-defining loci. Mutation causes the fitness of an allele to be multiplied by a log-normal random deviate of mean 1 and standard deviation s, the selection coefficient. We also tested a normal random deviate, and truncated distributions including only beneficial or harmful mutations. Results were similar in each case. (A) The allelic mismatch distribution obtained for the neutral microepidemic model is refitted to simulated populations with no clustering, produced with θ = 5.7, ρ = 17.1, and varying values of the selection coefficient. The fit remains good, but selection results in reduced estimates of θ (solid line) and ρ (dashed line) and negative values of he (diamonds). (BF) A single sample is drawn from a simulated population with both selection and clustering, with θ = ρ = 64, N = 2,000, and s = 0.1. The sample of size n = 250 includes nc = 25 epidemic clusters of mean size formula image, and we attempt to refit the neutral microepidemic model to this sample produced with selection. (B) The allelic mismatch distribution fits acceptably, resulting in estimates θ = 6.4, ρ = 9.6, and he = 0.015. However, the resulting nearest neighbor distribution (C) and the eburst analyses (D, sample simulated with selection and clustering; E, sample from best-fit neutral microepidemic model; F, summary statistics) fit poorly.

Similar articles

Cited by

References

    1. Maynard Smith, J., Smith, N. H., O'Rourke, M. & Spratt, B. G. (1993) Proc. Natl. Acad. Sci. USA 90, 4384–4388. - PMC - PubMed
    1. Spratt, B. G., Hanage, W. P. & Feil, E. J. (2001) Curr. Opin. Microbiol. 4, 602–606. - PubMed
    1. Ochman, H., Lawrence, J. G. & Groisman, E. A. (2000) Nature 405, 299–304. - PubMed
    1. Supply, P., Warren, R. M., Banuls, A. L., Lesjean, S., Van Der Spuy, G. D., Lewis, L. A., Tibayrenc, M., Van Helden, P. D. & Locht, C. (2003) Mol. Microbiol. 47, 529–538. - PubMed
    1. Smith, N. H., Dale, J., Inwald, J., Palmer, S., Gordon, S. V., Hewinson, R. G. & Smith, J. M. (2003) Proc. Natl. Acad. Sci. USA 100, 15271–15275. - PMC - PubMed

Publication types

MeSH terms