

Association of the NuMA region on chromosome 11q13 with breast cancer susceptibility
- PMID: 15684076
- PMCID: PMC548529
- DOI: 10.1073/pnas.0409806102
Association of the NuMA region on chromosome 11q13 with breast cancer susceptibility
Abstract
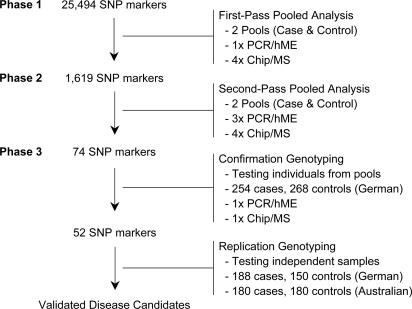
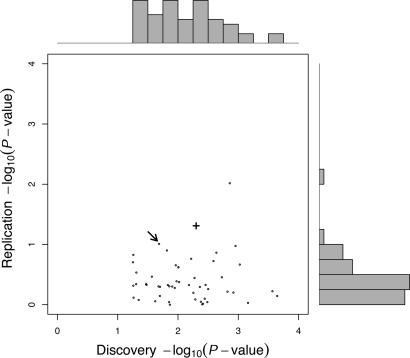
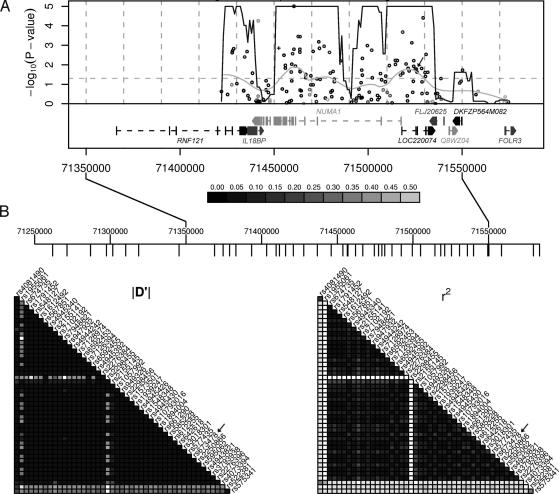
The development of breast cancer is a complex process that involves multiple genes at many stages, from initial cell cycle dysregulation to disease progression. To identify genetic variations that influence this process, we conducted a large-scale association study using a collection of German cases and controls and >25,000 SNPs located within 16,000 genes. One of the loci identified was located on chromosome 11q13 [odds ratio (OR)=1.85, P=0.017]. The initial association was subsequently tested in two independent breast cancer collections. In both sample sets, the frequency of the susceptibility allele was increased in the cases (OR=1.6, P=0.01). The susceptibility allele was also associated with an increase in cancer family history (P=0.1). Fine mapping showed that the region of association extends approximately 300 kb and spans several genes, including the gene encoding the nuclear mitotic apparatus protein (NuMA). A nonsynonymous SNP (A794G) in NuMA was identified that showed a stronger association with breast cancer risk than the initial marker SNP (OR=2.8, P=0.005 initial sample; OR=2.1, P=0.002 combined). NuMA is a cell cycle-related protein essential for normal mitosis that is degraded in early apoptosis. NuMA-retinoic acid receptor alpha fusion proteins have been described in acute promyelocytic leukemia. Although the potential functional relevance of the A794G variation requires further biological validation, we conclude that variations in the NuMA gene are likely responsible for the observed increased breast cancer risk.
Figures
References
-
- Greene, M. H. (1997) Mayo Clin. Proc. 72, 54–65. - PubMed
-
- Balmain, A., Gray, J. & Ponder, B. (2003) Nat. Genet. 33, 238–244. - PubMed
-
- Miki, Y., Swensen, J., Shattuck-Eidens, D., Futreal, P. A., Harshman, K., Tavtigian, S., Liu, Q., Cochran, C., Bennett, L. M., Ding, W., et al. (1994) Science 266, 66–71. - PubMed
-
- Wooster, R., Neuhausen, S. L., Mangion, J., Quirk, Y., Ford, D., Collins, N., Nguyen, K., Seal, S., Tran, T., Averill, D., et al. (1994) Science 265, 2088–2090. - PubMed
-
- Malkin, D., Li, F. P., Strong, L. C., Fraumeni, J. F., Jr., Nelson, C. E., Kim, D. H., Kassel, J., Gryka, M. A., Bischoff, F. Z., Tainsky, M. A., et al. (1990) Science 250, 1233–1238. - PubMed
MeSH terms
Substances
LinkOut - more resources
Full Text Sources
Other Literature Sources
Medical
Molecular Biology Databases
Research Materials
Miscellaneous
