

Chromatin architecture near a potential 3' end of the igh locus involves modular regulation of histone modifications during B-Cell development and in vivo occupancy at CTCF sites
- PMID: 15684400
- PMCID: PMC548023
- DOI: 10.1128/MCB.25.4.1511-1525.2005
Chromatin architecture near a potential 3' end of the igh locus involves modular regulation of histone modifications during B-Cell development and in vivo occupancy at CTCF sites
Abstract
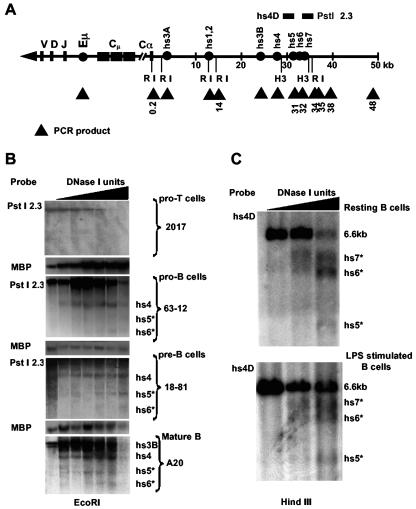
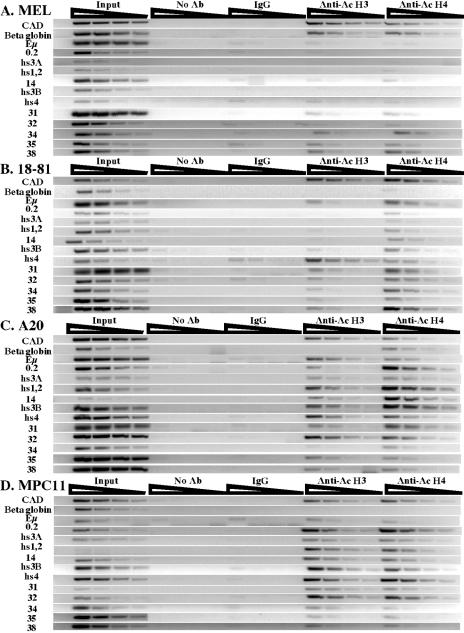
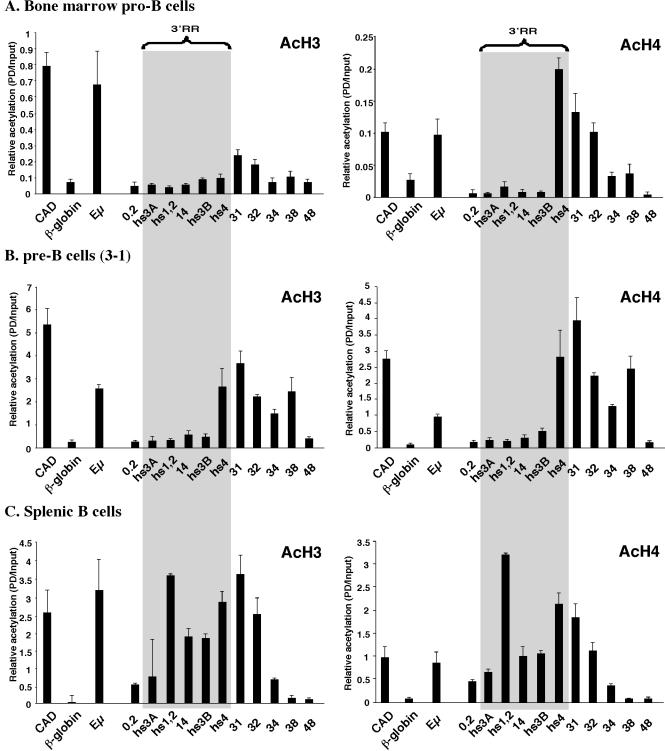
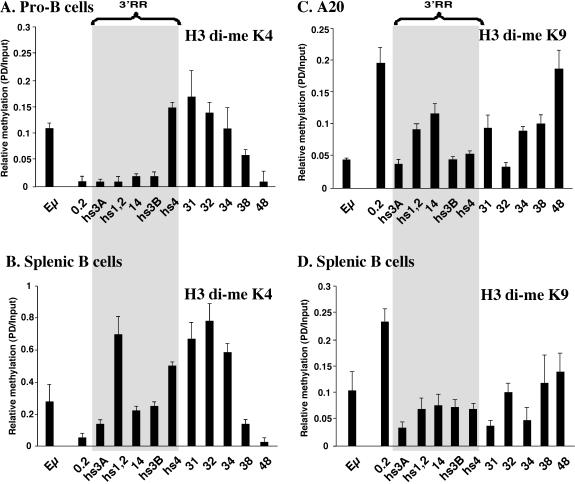
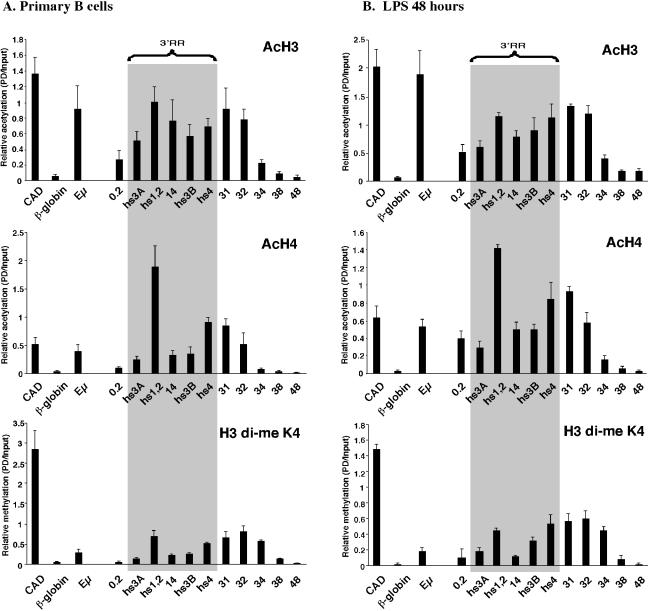
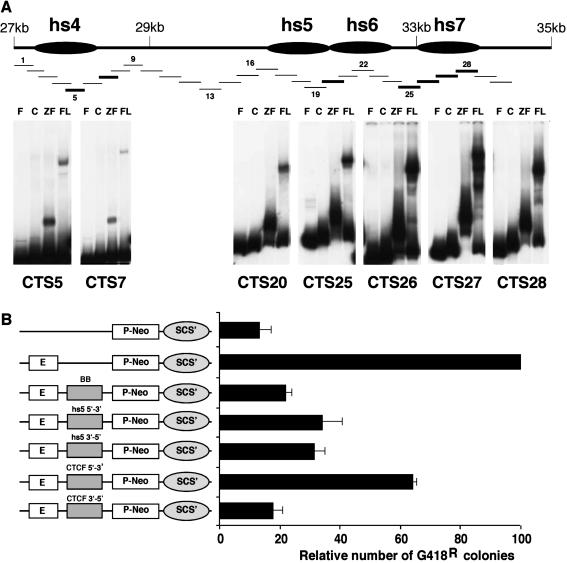
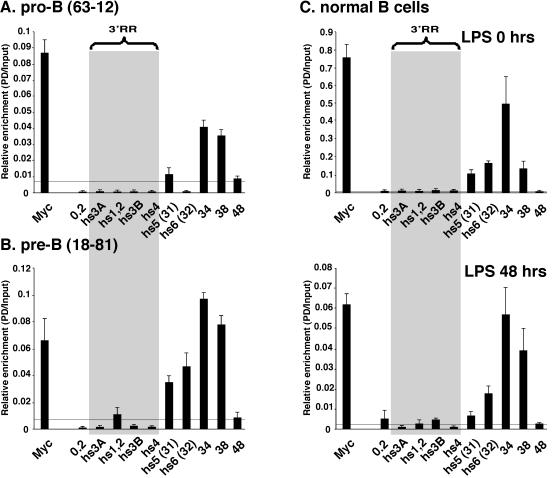
The murine Igh locus has a 3' regulatory region (3' RR) containing four enhancers (hs3A, hs1,2, hs3B, and hs4) at DNase I-hypersensitive sites. The 3' RR exerts long-range effects on class switch recombination (CSR) to several isotypes through its control of germ line transcription. By measuring levels of acetylated histones H3 and H4 and of dimethylated H3 (K4) with chromatin immunoprecipitation assays, we found that early in B-cell development, chromatin encompassing the enhancers of the 3' RR began to attain stepwise modifications typical of an open conformation. The hs4 enhancer was associated with active chromatin initially in pro- and pre-B cells and then together with hs3A, hs1,2, and hs3B in B and plasma cells. Histone modifications were similar in resting splenic B cells and in splenic B cells induced by lipopolysaccharide to undergo CSR. From the pro-B-cell stage onward, the approximately 11-kb region immediately downstream of hs4 displayed H3 and H4 modifications indicative of open chromatin. This region contained newly identified DNase I-hypersensitive sites and several CTCF target sites, some of which were occupied in vivo in a developmentally regulated manner. The open chromatin environment of the extended 3' RR in mature B cells was flanked by regions associated with dimethylated K9 of histone H3. Together, these data suggest that 3' RR elements are located within a specific chromatin subdomain that contains CTCF binding sites and developmentally regulated modules.
Figures
Similar articles
-
Dynamic changes in binding of immunoglobulin heavy chain 3' regulatory region to protein factors during class switching.J Biol Chem. 2011 Aug 19;286(33):29303-29312. doi: 10.1074/jbc.M111.243543. Epub 2011 Jun 17. J Biol Chem. 2011. PMID: 21685395 Free PMC article.
-
Pax5 and linker histone H1 coordinate DNA methylation and histone modifications in the 3' regulatory region of the immunoglobulin heavy chain locus.Mol Cell Biol. 2008 Oct;28(19):6123-33. doi: 10.1128/MCB.00233-08. Epub 2008 Jul 21. Mol Cell Biol. 2008. PMID: 18644860 Free PMC article.
-
Regulation of epsilon germline transcription and switch region mutations by IgH locus 3' enhancers in transgenic mice.Blood. 2007 Jan 1;109(1):159-67. doi: 10.1182/blood-2006-02-005355. Epub 2006 Sep 12. Blood. 2007. PMID: 16968901
-
Epigenetic Regulation of Individual Modules of the immunoglobulin heavy chain locus 3' Regulatory Region.Front Immunol. 2014 Apr 21;5:163. doi: 10.3389/fimmu.2014.00163. eCollection 2014. Front Immunol. 2014. PMID: 24795714 Free PMC article. Review.
-
Dynamic Control of Long-Range Genomic Interactions at the Immunoglobulin κ Light-Chain Locus.Adv Immunol. 2015;128:183-271. doi: 10.1016/bs.ai.2015.07.004. Epub 2015 Aug 14. Adv Immunol. 2015. PMID: 26477368 Review.
Cited by
-
Matters of life and death: How estrogen and estrogen receptor binding to the immunoglobulin heavy chain locus may influence outcomes of infection, allergy, and autoimmune disease.Cell Immunol. 2019 Dec;346:103996. doi: 10.1016/j.cellimm.2019.103996. Epub 2019 Oct 25. Cell Immunol. 2019. PMID: 31703914 Free PMC article. Review.
-
Chromatin accessibility mapping identifies mediators of basal transcription and retinoid-induced repression of OTX2 in medulloblastoma.PLoS One. 2014 Sep 8;9(9):e107156. doi: 10.1371/journal.pone.0107156. eCollection 2014. PLoS One. 2014. PMID: 25198066 Free PMC article.
-
S-S synapsis during class switch recombination is promoted by distantly located transcriptional elements and activation-induced deaminase.Immunity. 2007 Nov;27(5):711-22. doi: 10.1016/j.immuni.2007.09.007. Epub 2007 Nov 1. Immunity. 2007. PMID: 17980632 Free PMC article.
-
Chromatin architecture, CCCTC-binding factor, and V(D)J recombination: managing long-distance relationships at antigen receptor loci.J Immunol. 2013 May 15;190(10):4915-21. doi: 10.4049/jimmunol.1300218. J Immunol. 2013. PMID: 23645930 Free PMC article. Review.
-
Switch recombination and somatic hypermutation are controlled by the heavy chain 3' enhancer region.J Exp Med. 2009 Nov 23;206(12):2613-23. doi: 10.1084/jem.20091280. Epub 2009 Nov 2. J Exp Med. 2009. PMID: 19887393 Free PMC article.
References
-
- Alt, F., N. Rosenberg, S. Lewis, E. Thomas, and D. Baltimore. 1981. Organization and reorganization of immunoglobulin genes in A-MuLV-transformed cells: rearrangement of heavy but not light chain genes. Cell 27:381-390. - PubMed
-
- Barlev, N. A., A. V. Emelyanov, P. Castagnino, P. Zegerman, A. J. Bannister, M. A. Sepulveda, F. Robert, L. Tora, T. Kouzarides, B. K. Birshtein, and S. L. Berger. 2003. A novel human Ada2 homologue functions with Gcn5 or Brg1 to coactivate transcription. Mol. Cell. Biol. 23:6944-6957. - PMC - PubMed
-
- Bell, A. C., A. G. West, and G. Felsenfeld. 1999. The protein CTCF is required for the enhancer blocking activity of vertebrate insulators. Cell 98:387-396. - PubMed
-
- Bradney, C., M. Hjelmeland, Y. Komatsu, M. Yoshida, T. P. Yao, and Y. Zhuang. 2003. Regulation of E2A activities by histone acetyltransferases in B lymphocyte development. J. Biol. Chem. 278:2370-2376. - PubMed
Publication types
MeSH terms
Substances
Grants and funding
LinkOut - more resources
Full Text Sources
Other Literature Sources
Molecular Biology Databases
Research Materials
Miscellaneous