. 2005 Feb;25(4):1537-48.
doi: 10.1128/MCB.25.4.1537-1548.2005.

Insulin-mediated down-regulation of apolipoprotein A5 gene expression through the phosphatidylinositol 3-kinase pathway: role of upstream stimulatory factor

Affiliations

Insulin-mediated down-regulation of apolipoprotein A5 gene expression through the phosphatidylinositol 3-kinase pathway: role of upstream stimulatory factor

Maxime Nowak et al. Mol Cell Biol. 2005 Feb.

Abstract

The apolipoprotein A5 gene (APOA5) has been repeatedly implicated in lowering plasma triglyceride levels. Since several studies have demonstrated that hyperinsulinemia is associated with hypertriglyceridemia, we sought to determine whether APOA5 is regulated by insulin. Here, we show that cell lines and mice treated with insulin down-regulate APOA5 expression in a dose-dependent manner. Furthermore, we found that insulin decreases human APOA5 promoter activity, and subsequent deletion and mutation analyses uncovered a functional E box in the promoter. Electrophoretic mobility shift and chromatin immunoprecipitation assays demonstrated that this APOA5 E box binds upstream stimulatory factors (USFs). Moreover, in transfection studies, USF1 stimulates APOA5 promoter activity, and the treatment with insulin reduced the binding of USF1/USF2 to the APOA5 promoter. The inhibition of the phosphatidylinositol 3-kinase (PI3K) pathway abolished insulin's effect on APOA5 gene expression, while the inhibition of the P70 S6 kinase pathway with rapamycin reversed its effect and increased APOA5 gene expression. Using an oligonucleotide precipitation assay for USF from nuclear extracts, we demonstrate that phosphorylated USF1 fails to bind to the APOA5 promoter. Taken together, these data indicate that insulin-mediated APOA5 gene transrepression could involve a phosphorylation of USFs through the PI3K and P70 S6 kinase pathways that modulate their binding to the APOA5 E box and results in APOA5 down-regulation. The effect of exogenous hyperinsulinemia in men showed a decrease in the plasma ApoAV level. These results suggest a potential contribution of the APOA5 gene in hypertriglyceridemia associated with hyperinsulinemia.


Figures

FIG. 1.
FIG. 1.
Time- and dose-dependent down-regulation of APOA5 gene expression by insulin. APOA5 mRNA levels in hepatocytes were measured as described in Materials and Methods. (A) Effect of 10 nM insulin on APOA5 gene expression in different hepatocyte models treated during 24 h. The decrease (n-fold) in APOA5 gene expression is shown (black bars) versus control (white bar) (means ± SD; n = 3). (B) HuH7 cells were cultured for different times with 10 nM insulin. Results are representative of three independent experiments. (C) Primary rat hepatocytes were cultured for 24 h in the presence of increasing insulin concentrations up to 10 nM. (D) C57BL/6 mice were injected intraperitoneally with 0.5 or 1 U/kg of insulin (black bars) or vehicle as a control (white bars). Total RNA from liver was extracted 6 h after injection and subjected to a quantitative PCR using 36B4 as a normalizing gene. The decrease (n-fold) in apoa5 gene expression is shown (means ± SD; n = 6). Statistically significant differences between groups versus control were obtained with a Student t test and are indicated by asterisks (*, 0.01 < P < 0.05; **, 0.0001 < P < 0.01; and ***, P < 0.0001).
FIG. 2.
FIG. 2.
Effects of cycloheximide and actinomycin D on insulin down-regulation of APOA5 mRNA. Hepatocytes were pretreated with cycloheximide (CHX; 5 μg/ml) or actinomycin D (ActD; 2.5 μg/ml) for 2 h or 90 min, respectively, and treated during 6, 12, or 24 h with 10 nM insulin. Results obtained after 24 h of treatment are shown. The APOA5 steady-state mRNA levels were measured by quantitative PCR using 36B4 as a normalizing gene. Experiments were repeated at least three times, and a representative result is shown.
FIG. 3.
FIG. 3.
Effect of insulin on the human APOA5 promoter activity, deletion analysis of the APOA5 promoter, and c functional analysis of the APOA5 E-box element. (A) HepG2 cells were transfected with empty reporter plasmid (striped bars) or the −304/+63 human APOA5 promoter fragment reporter plasmid (full bars). Cells were treated with different concentrations of insulin and were lysed after 24 h of treatment. (B) Schematic illustration of the reporter constructs used in the transfection studies. Boxed sequences represent the E box. Cells were transfected with different human APOA5 promoter fragment reporter plasmids and treated with insulin. After 24 h of treatment, the luciferase activity was measured. (C) HepG2 cells were transfected with the APOA5 promoter fragment containing the wild-type E box and with a construction containing a mutation of this E box. The luciferase activity was measured and expressed as described in Materials and Methods. Results were expressed as means ± SD (n = 3). Experiments were repeated at least three times, and a representative result is shown. Statistically significant differences between groups versus control were obtained with a Student's t test and are indicated by asterisks (*, 0.01 < P < 0.05; **, 0.0001 < P < 0.01; and ***, P < 0.0001). White bars represent the control without insulin, and black bars represent the promoter activity after a treatment with insulin.
FIG. 3.
FIG. 3.
Effect of insulin on the human APOA5 promoter activity, deletion analysis of the APOA5 promoter, and c functional analysis of the APOA5 E-box element. (A) HepG2 cells were transfected with empty reporter plasmid (striped bars) or the −304/+63 human APOA5 promoter fragment reporter plasmid (full bars). Cells were treated with different concentrations of insulin and were lysed after 24 h of treatment. (B) Schematic illustration of the reporter constructs used in the transfection studies. Boxed sequences represent the E box. Cells were transfected with different human APOA5 promoter fragment reporter plasmids and treated with insulin. After 24 h of treatment, the luciferase activity was measured. (C) HepG2 cells were transfected with the APOA5 promoter fragment containing the wild-type E box and with a construction containing a mutation of this E box. The luciferase activity was measured and expressed as described in Materials and Methods. Results were expressed as means ± SD (n = 3). Experiments were repeated at least three times, and a representative result is shown. Statistically significant differences between groups versus control were obtained with a Student's t test and are indicated by asterisks (*, 0.01 < P < 0.05; **, 0.0001 < P < 0.01; and ***, P < 0.0001). White bars represent the control without insulin, and black bars represent the promoter activity after a treatment with insulin.
FIG. 4.
FIG. 4.
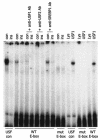
EMSA and supershift assay of nuclear extracts. Experiments were performed with nuclear extracts from HepG2 cells or with in vitro transcribed-translated human USF1 or unprogrammed reticulocyte lysate. Each reaction contained 2.5 μg of nuclear extracts, 1× gel shift reaction buffer, 2.5 μg of poly(dI-dC), 1 μg of herring sperm DNA, and 1 μl of [γ-32P]ATP-labeled probe. Three probes were used for experiments: a USF consensus E box as the control (con) probe, a wild-type (WT) APOA5 E-box-containing probe, and a mutated (mut) APOA5 E-box-containing probe. For the supershift assay, 1 μg of specific antibodies was added in the reaction mixture. After incubations on ice, samples were applied to a 5% nondenaturing polyacrylamide gel. The gel was dried and exposed to a film with an intensifying screen. Experiments were repeated at least three times.
FIG. 5.
FIG. 5.
ChIP analysis of USF interaction with APOA5 promoter in vivo. (A) Western blot analysis of immunoprecipitated USF in HepG2 cells. As a negative control, chromatin immunoprecipitation was performed without antibodies (USF1). (B) Schematic representation showing the USF binding site (E box). Two arrows indicate primers used for amplifying the region from −292 to +6 spanning the USF binding site. (C) Formaldehyde cross-linked chromatin isolated from HepG2 cells was immunoprecipitated with antibodies and subjected to PCR as described in Materials and Methods. PCR products were electrophoresed on 2% agarose gel.
FIG. 6.
FIG. 6.
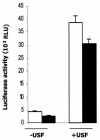
E-box requirement for insulin regulation of the APOA5 promoter. HepG2 cells were cotransfected with the −304/+63 human APOA5 promoter fragment reporter plasmid and the USF1 expression plasmid. After 24 h of treatment with 10 nM insulin, cells were lysed, and the luciferase activity was measured and expressed as described in Materials and Methods. Results were expressed in luciferase activity (means ± SD; n = 3). Experiments were repeated at least three times, and a representative result is shown. Black bars, insulin; white bars, control; RLU, relative light units.
FIG. 7.
FIG. 7.
Effects of phosphorylation inhibitors on the APOA5 gene expression down-regulation by insulin. Before the addition of insulin, inhibitors were added to treat HuH7 cells for 1 h. The concentrations used were as follow: LY294002, 10 μM; wortmannin, 10 nM; PD98059, 10 μM; staurosporine, 5 nM; and rapamycin, 10 nM. The same volume of vehicle (DMSO) was used as the negative control (white bar). Cells were incubated with 10 nM insulin (black bars) for 24 h. Total RNA was isolated from the cells and subjected to a quantitative PCR using 36B4 as normalizing gene. Induction (n-fold) of APOA5 gene expression is shown (means ± SD; n = 3). Experiments were repeated three times, and a representative result is shown.
FIG. 8.
FIG. 8.
Oligonucleotide precipitation of USF1 from hepatic nuclear extracts. The experiment was performed by using 10 μg of nuclear extracts from HepG2 cells. First, a 5′ -biotin-labeled oligonucleotide probe containing the APOA5 E box was used for the formation of the oligonucleotide-protein complex. Then, streptavidin-Sepharose beads were added to interact with the biotinylated DNA-protein complex. Immunoblot analyses were done with anti-USF1, antiphosphothreonine, or antiphosphoserine as the primary antibody. Experiments were repeated at least three times, and a representative result is shown. Ab, antibody.
FIG. 9.
FIG. 9.
Effects of insulin on the plasma ApoAV protein level in humans. Plasma ApoAV protein level was measured in humans after infusion of insulin (solid line) or saline (dashed line). Insulin was infused at a rate of 1 mU/kg/min for 8 h. Blood samplings from each subject were collected at different times. The first sample was collected 30 min before the beginning of insulin or saline infusion; the second sample was collected just after the start of infusion. The third and the fourth samples were collected 3.5 and 8 h, respectively, after the infusion. Results are expressed as means ± SD (n = 12). Statistically significant differences between groups versus the control were obtained with a Student's t test and are indicated by asterisks (*, 0.01 < P < 0.05; **, 0.0001 < P < 0.01; and ***, P < 0.0001).
FIG. 10.
FIG. 10.
A proposed model for the roles of USF1 and USF2 in the regulation of APOA5 gene transcription. Under insulin, the PI3K pathway is stimulated, inducing a phosphorylation of USF. The phosphorylated complexes lose their ability to bind APOA5 promoter and, consequently, their transactivation function.

Similar articles

Cited by

References

    1. Aouizerat, B. E., M. Kulkarni, D. Heilbron, D. Drown, S. Raskin, C. R. Pullinger, M. J. Malloy, and J. P. Kane. 2003. Genetic analysis of a polymorphism in the human apolipoprotein A-V gene: effect on plasma lipids. J. Lipid Res. 44:1167-1173. - PubMed
    1. Baroukh, N., E. Bauge, J. Akiyama, J. Chang, V. Afzal, J. C. Fruchart, E. M. Rubin, J. Fruchart, and L. A. Pennacchio. 2004. Analysis of apolipoprotein A5, C3, and plasma triglyceride concentrations in genetically engineered mice. Arterioscler. Thromb. Vasc. Biol. 24:1297-1302. - PubMed
    1. Baum, L., B. Tomlinson, and G. Thomas. 2003. APOA5-1131T>C polymorphism is associated with triglyceride levels in Chinese men. Clin. Genet. 63:377-379. - PubMed
    1. Brown, M. S., and J. L. Goldstein. 1997. The SREBP pathway: regulation of cholesterol metabolism by proteolysis of a membrane-bound transcription factor. Cell 89:331-340. - PubMed
    1. Burgering, B. M., and P. J. Coffer. 1995. Protein kinase B (c-Akt) in phosphatidylinositol-3-OH kinase signal transduction. Nature 376:599-602. - PubMed

Publication types

MeSH terms

Substances