. 2005 Jan 31;33(2):605-15.
doi: 10.1093/nar/gki166. Print 2005.

Extraction of transcription regulatory signals from genome-wide DNA-protein interaction data

Affiliations

Extraction of transcription regulatory signals from genome-wide DNA-protein interaction data

Yael Garten et al. Nucleic Acids Res. .

Abstract

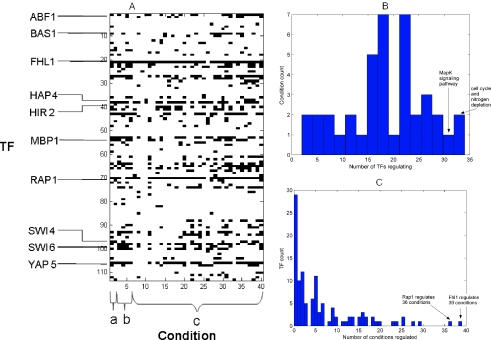
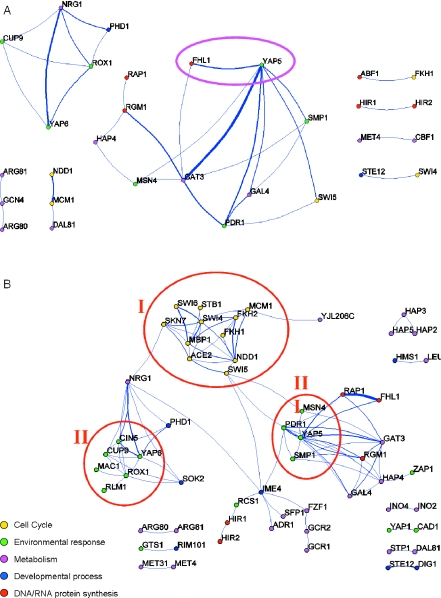
Deciphering gene regulatory network architecture amounts to the identification of the regulators, conditions in which they act, genes they regulate, cis-acting motifs they bind, expression profiles they dictate and more complex relationships between alternative regulatory partnerships and alternative regulatory motifs that give rise to sub-modalities of expression profiles. The 'location data' in yeast is a comprehensive resource that provides transcription factor-DNA interaction information in vivo. Here, we provide two contributions: first, we developed means to assess the extent of noise in the location data, and consequently for extracting signals from it. Second, we couple signal extraction with better characterization of the genetic network architecture. We apply two methods for the detection of combinatorial associations between transcription factors (TFs), the integration of which provides a global map of combinatorial regulatory interactions. We discover the capacity of regulatory motifs and TF partnerships to dictate fine-tuned expression patterns of subsets of genes, which are clearly distinct from those displayed by most genes assigned to the same TF. Our findings provide carefully prioritized, high-quality assignments between regulators and regulated genes and as such should prove useful for experimental and computational biologists alike.


Figures

Figure 1
Figure 1
(A) A matrix depicting EC of each TF in each condition. An ij-th entry in the matrix is colored black if the i-th TF was significantly coherent in the j-th condition, and white otherwise. Conditions marked as ‘a’ are Cho's cell cycle (12) and Chu's sporulation (16), in ‘b’ are Spellman's four cell-cycle conditions (10) and in ‘c’ are predominantly stress responses (–15,17). Selected TFs are designated by their names; all TF and condition names, along with textual version of the matrix, are available online. (B) A histogram with the number of TFs regulating each condition. (C) A histogram depicting the number of conditions regulated by each TF.
Figure 2
Figure 2
Expression profiles of genes regulated by Abf1 during sporulation (A) and Bas1 during nitrogen depletion (B). The first box on the left in each panel represents the expression profiles of all the genes assigned by the location data to the respective TFs. The rest of the boxes represent the results of decomposition of these genes into the most populated clusters generated by QT_clust. In (A), genes containing NCGTNNNNARTGAT and CGATGAGMTK are colored green, genes with only the first motif are colored blue, genes with only the second motif are colored red and genes with none of the motifs are black. In (B), genes containing the RNMRGAGTCA motif in their promoter are colored green, the rest are blue.
Figure 3
Figure 3
Genes assigned to Ndd1 in the Carbon-1 medium in the environmental stress experiment (A) and Yap5 during exposure to the reducing agent dtt (B) (13), with the same QT_clust-based clustering as in Figure 2. In (A), genes that are assigned to Ndd1 and Swi5 are colored red, while genes that are assigned to Ndd1 and Mcm1 are colored green. Genes assigned to Ndd1, but not to Swi5 and not to Mcm1 are colored blue. In (B), genes that are assigned also to Fhl1 are colored red, while genes only assigned to Yap5 are blue.
Figure 4
Figure 4
Graphs depicting TF synergy during exposure to the reducing agent dtt (A), and co-localization (B). The nodes in the maps represent TFs, an edge between two nodes represents significant synergy in (A), and significant (p-value < 10−10) co-localization in (B), between the two corresponding TFs. Graph rendering was performed with Pajek (). Two nodes that are analyzed in detail in Figure 3B, that correspond to Yap5 and Fhl1, are highlighted in (A). The three main clusters of co-localized TFs are circled red in (B). Nodes in (B) are colored according to the regulatory function of the TFs. Such functions were annotated in (1) according to the biological function of genes assigned to the TF. Width of lines connecting two TFs reflects the number of genes assigned to both TFs; size of node reflects the number of genes assigned to the TF.
Figure 5
Figure 5
(A) Table displaying number of TF-gene assignments supported by all possible combinations of methods. For each combination marked by gray boxes, the number of assignments supported by this unique combination of methods is reported. The first column reports the number of assignments supported by all of the methods marked in each row (an ‘AND’ relationship between the methods), while the second column reports assignments supported by any of the methods (an ‘OR’ relationship). For example, the 5th row reports that there are 1009 interactions supported by both the coherence and the motif method (and not supported by the other methods), and 1706 interactions supported by either the coherence or the motif method (and not supported by the other methods). For further details, see Supporting website. (B) Venn diagram depicting the relationships among the TF-gene interaction predictions of three methods of filtration: motif detection, synergy and co-localization. A total of 3626 unique interactions were predicted by at least one of the three methods, and 1527 interactions were predicted by all three methods.

References

    1. Lee T.I., Rinaldi N.J., Robert F., Odom D.T., Bar-Joseph Z., Gerber G.K., Hannett N.M., Harbison C.T., Thompson C.M., Simon I., et al. Transcriptional regulatory networks in Saccharomyces cerevisiae. Science. 2002;298:799–804. - PubMed
    1. Benjamini Y., Hochberg Y. Controlling the false discovery rate: a practical and powerful approach to multiple testing. J. R. Stat. Soc. 1995;57:289–300.
    1. Gao F., Foat B.C., Bussemaker H.J. Defining transcriptional networks through integrative modeling of mRNA expression and transcription factor binding data. BMC Bioinformatics. 2004;5:31. - PMC - PubMed
    1. Segal E., Yelensky R., Koller D. Genome-wide discovery of transcriptional modules from DNA sequence and gene expression. Bioinformatics. 2003;19:i273–i282. - PubMed
    1. Storey J.D., Tibshirani R. Statistical significance for genomewide studies. Proc. Natl Acad. Sci. USA. 2003;100:9440–9445. - PMC - PubMed

Publication types

MeSH terms