

Host gene expression changes and DNA amplification during temperate phage induction
- PMID: 15687213
- PMCID: PMC545606
- DOI: 10.1128/JB.187.4.1485-1492.2005
Host gene expression changes and DNA amplification during temperate phage induction
Abstract
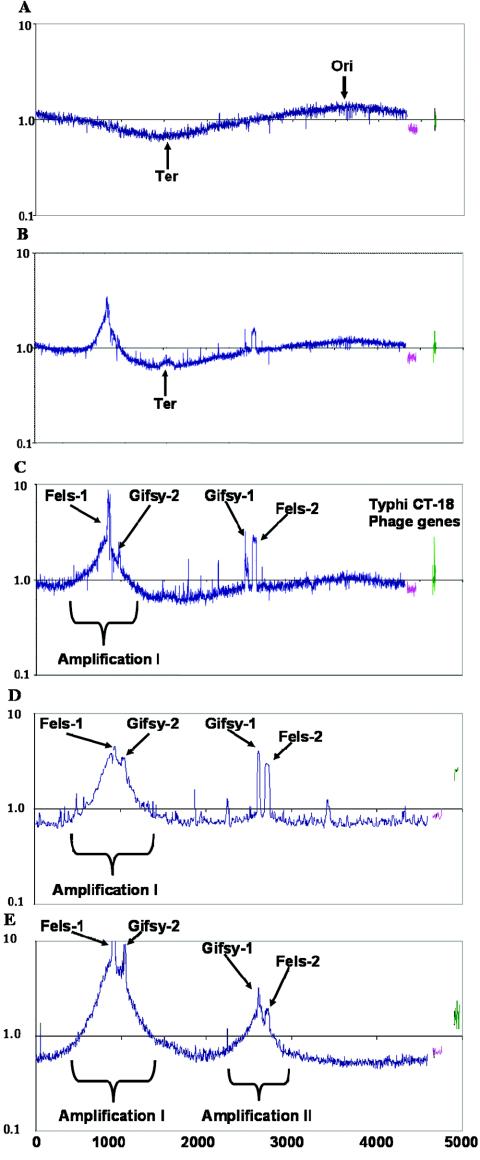
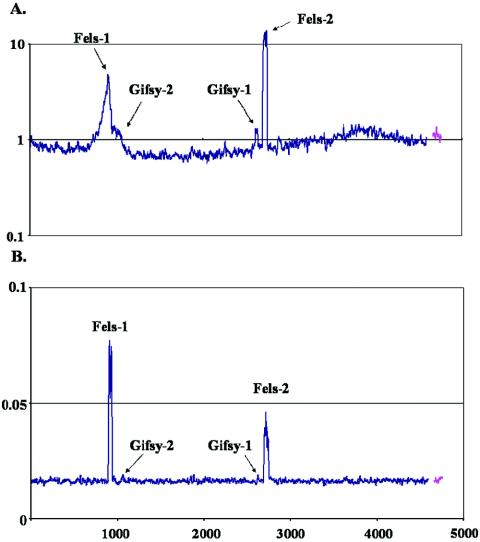
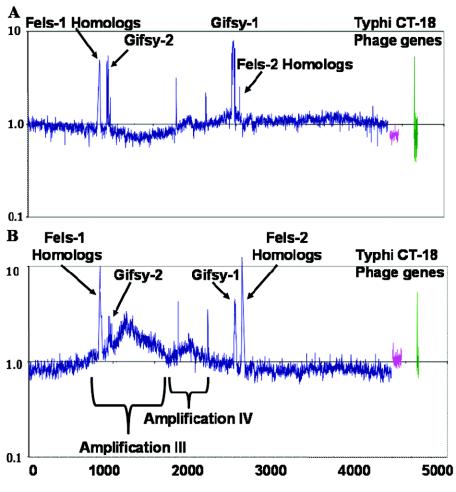
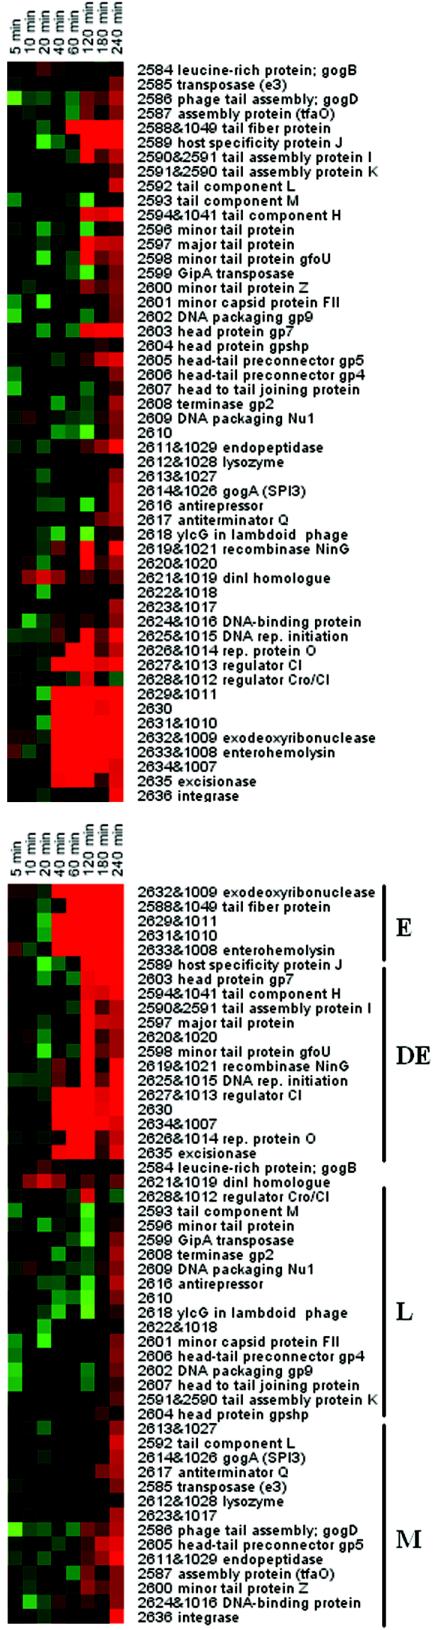
Salmonella enterica serovar Typhimurium LT2 harbors four temperate prophages. The lytic cycle of these phages was induced with hydrogen peroxide or mitomycin C. Microarray analysis was used to monitor the increase in phage genome copy number and the changes in RNA expression. Phage gene transcription was classified temporally, and host genes that responded to hydrogen peroxide, mitomycin C, or phage induction were also identified. A region of the serovar Typhimurium LT2 host genome encompassing hundreds of genes, flanking the Fels-1 lambdoid prophage, was amplified manyfold during lytic induction, presumably due to Fels-1 runoff replication prior to excision, a phenomenon termed escape replication. An excisionase (xis) mutant of Fels-1 also induced escape replication but did not get packaged. Gifsy-1, a lambdoid prophage that does not normally produce escape replication, did so after deletion of either its integrase or excisionase genes. Escape replication is probably widespread; large regions of host genome amplification were also observed after phage induction in serovar Typhimurium strains SL1344 and 14028s at the suspected integration site of prophage genomes.
Figures
Similar articles
-
The SopEPhi phage integrates into the ssrA gene of Salmonella enterica serovar Typhimurium A36 and is closely related to the Fels-2 prophage.J Bacteriol. 2003 Sep;185(17):5182-91. doi: 10.1128/JB.185.17.5182-5191.2003. J Bacteriol. 2003. PMID: 12923091 Free PMC article.
-
Stress-induced prophage DNA replication in Salmonella enterica serovar Typhimurium.Infect Genet Evol. 2009 Sep;9(5):889-95. doi: 10.1016/j.meegid.2009.05.017. Epub 2009 Jun 6. Infect Genet Evol. 2009. PMID: 19501196
-
Resuscitation of a defective prophage in Salmonella cocultures.J Bacteriol. 2004 Jun;186(12):4038-41. doi: 10.1128/JB.186.12.4038-4041.2004. J Bacteriol. 2004. PMID: 15175320 Free PMC article.
-
Plasmids derived from Gifsy-1/Gifsy-2, lambdoid prophages contributing to the virulence of Salmonella enterica serovar Typhimurium: implications for the evolution of replication initiation proteins of lambdoid phages and enterobacteria.Microbiology (Reading). 2007 Jun;153(Pt 6):1884-1896. doi: 10.1099/mic.0.2006/000802-0. Microbiology (Reading). 2007. PMID: 17526845
-
Replication and Maintenance of Linear Phage-Plasmid N15.Microbiol Spectr. 2015 Feb;3(1):PLAS-0032-2014. doi: 10.1128/microbiolspec.PLAS-0032-2014. Microbiol Spectr. 2015. PMID: 26104561 Review.
Cited by
-
Chromosomal Replication Complexity: A Novel DNA Metrics and Genome Instability Factor.PLoS Genet. 2016 Oct 6;12(10):e1006229. doi: 10.1371/journal.pgen.1006229. eCollection 2016 Oct. PLoS Genet. 2016. PMID: 27711112 Free PMC article. Review.
-
Two DNA invertases contribute to flagellar phase variation in Salmonella enterica serovar Typhimurium strain LT2.J Bacteriol. 2006 Feb;188(3):950-7. doi: 10.1128/JB.188.3.950-957.2006. J Bacteriol. 2006. PMID: 16428399 Free PMC article.
-
Global analysis of host response to induction of a latent bacteriophage.BMC Microbiol. 2007 Aug 31;7:82. doi: 10.1186/1471-2180-7-82. BMC Microbiol. 2007. PMID: 17764558 Free PMC article.
-
Gifsy-1 Prophage IsrK with Dual Function as Small and Messenger RNA Modulates Vital Bacterial Machineries.PLoS Genet. 2016 Apr 8;12(4):e1005975. doi: 10.1371/journal.pgen.1005975. eCollection 2016 Apr. PLoS Genet. 2016. PMID: 27057757 Free PMC article.
-
Strain-Specific Gifsy-1 Prophage Genes Are Determinants for Expression of the RNA Repair Operon during the SOS Response in Salmonella enterica Serovar Typhimurium.J Bacteriol. 2023 Jan 26;205(1):e0026222. doi: 10.1128/jb.00262-22. Epub 2023 Jan 9. J Bacteriol. 2023. PMID: 36622230 Free PMC article.
References
-
- Affolter, M., C. Parent-Vaugeois, and A. Anderson. 1983. Curing and induction of the Fels 1 and Fels 2 prophages in the Ames mutagen tester strains of Salmonella typhimurium. Mutat. Res. 110:243-262. - PubMed
-
- Boyd, E. F., and H. Brussow. 2002. Common themes among bacteriophage-encoded virulence factors and diversity among the bacteriophages involved. Trends Microbiol. 10:521-529. - PubMed
Publication types
MeSH terms
Substances
Grants and funding
LinkOut - more resources
Full Text Sources
Molecular Biology Databases
