

Bacterial persistence: a model of survival in changing environments
- PMID: 15687275
- PMCID: PMC1449587
- DOI: 10.1534/genetics.104.035352
Bacterial persistence: a model of survival in changing environments
Abstract
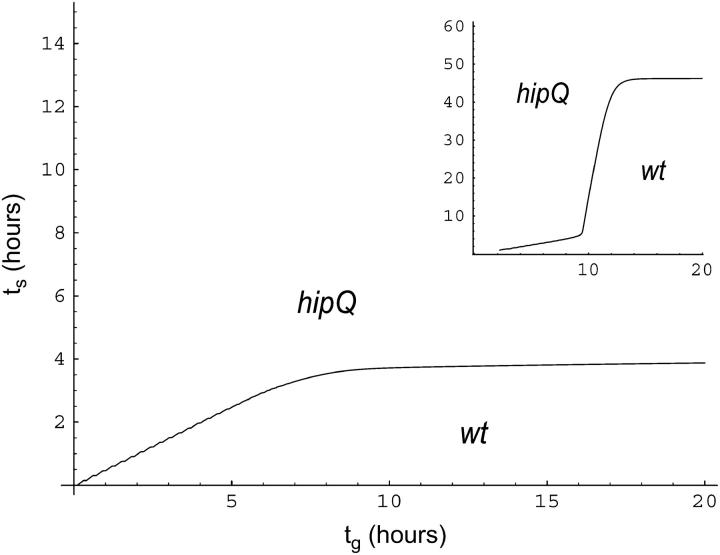
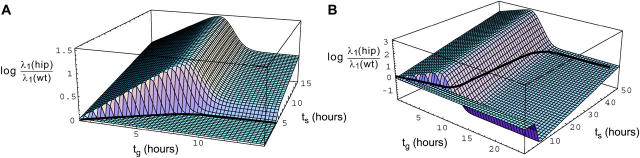
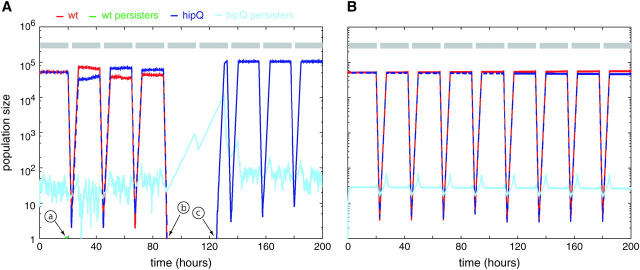
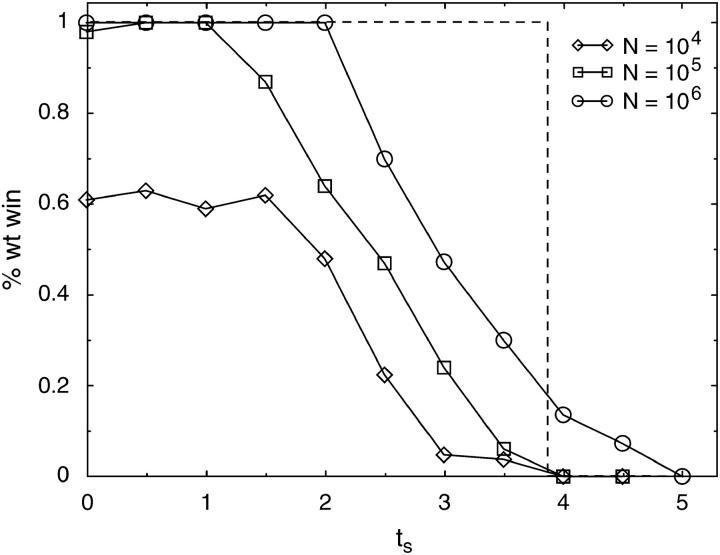
The persistence phenotype is an epigenetic trait exhibited by a subpopulation of bacteria, characterized by slow growth coupled with an ability to survive antibiotic treatment. The phenotype is acquired via a spontaneous, reversible switch between normal and persister cells. These observations suggest that clonal bacterial populations may use persister cells, whose slow division rate under growth conditions leads to lower population fitness, as an "insurance policy" against antibiotic encounters. We present a model of Escherichia coli persistence, and using experimentally derived parameters for both wild type and a mutant strain (hipQ) with markedly different switching rates, we show how fitness loss due to slow persister growth pays off as a risk-reducing strategy. We demonstrate that wild-type persistence is suited for environments in which antibiotic stress is a rare event. The optimal rate of switching between normal and persister cells is found to depend strongly on the frequency of environmental changes and only weakly on the selective pressures of any given environment. In contrast to typical examples of adaptations to features of a single environment, persistence appears to constitute an adaptation that is tuned to the distribution of environmental change.
Figures
References
-
- Balaban, N. Q., J. Merrin, R. Chait and S. Leibler, 2004. Bacterial persistence as a phenotypic switch. Science 305: 1622–1625. - PubMed
-
- Bharucha-Reid, A. T., 1960 Elements of the Theory of Markov Processes and Their Applications. Dover Publications, Mineola, NY.
-
- Bigger, J. W., 1944 Treatment of staphylococcal infections with penicillin. Lancet ii: 497–500.
-
- Cooper, W. S., and R. H. Kaplan, 1982. Adaptive coin-flipping—a decision—theoretic examination of natural-selection for random individual variation. J. Theor. Biol. 94: 135–151. - PubMed
-
- de Visser, J., 2002. The fate of microbial mutators. Microbiology 148: 1247–1252. - PubMed
Publication types
MeSH terms
LinkOut - more resources
Full Text Sources
Other Literature Sources
