. 2005 Feb;15(2):269-75.
doi: 10.1101/gr.3185605.

Highly multiplexed molecular inversion probe genotyping: over 10,000 targeted SNPs genotyped in a single tube assay

Affiliations

Highly multiplexed molecular inversion probe genotyping: over 10,000 targeted SNPs genotyped in a single tube assay

Paul Hardenbol et al. Genome Res. 2005 Feb.

Abstract

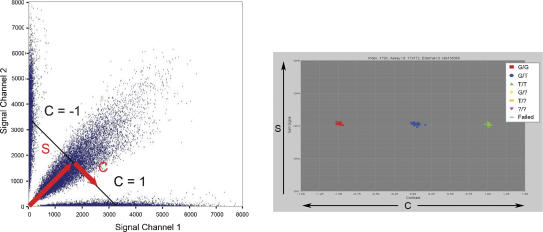
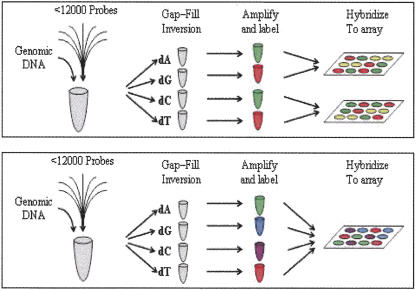
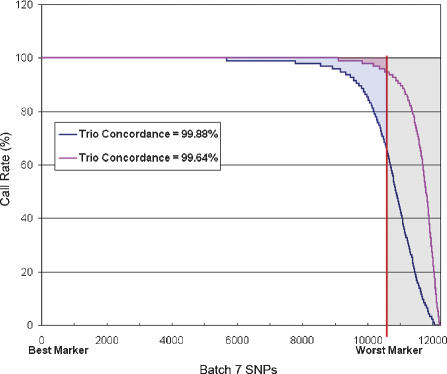
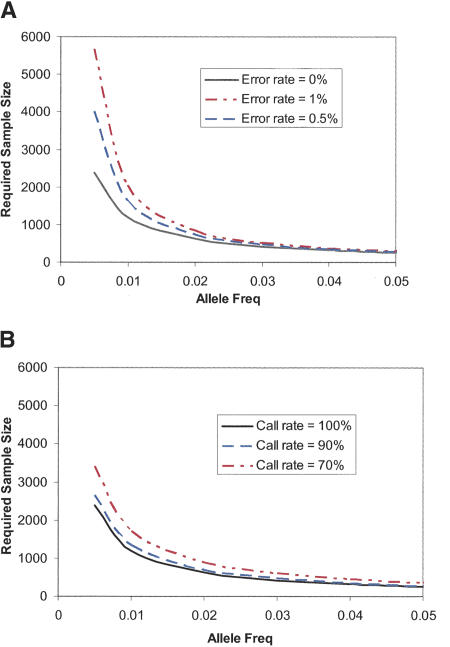
Large-scale genetic studies are highly dependent on efficient and scalable multiplex SNP assays. In this study, we report the development of Molecular Inversion Probe technology with four-color, single array detection, applied to large-scale genotyping of up to 12,000 SNPs per reaction. While generating 38,429 SNP assays using this technology in a population of 30 trios from the Centre d'Etude Polymorphisme Humain family panel as part of the International HapMap project, we established SNP conversion rates of approximately 90% with concordance rates >99.6% and completeness levels >98% for assays multiplexed up to 12,000plex levels. Furthermore, these individual metrics can be "traded off" and, by sacrificing a small fraction of the conversion rate, the accuracy can be increased to very high levels. No loss of performance is seen when scaling from 6,000plex to 12,000plex assays, strongly validating the ability of the technology to suppress cross-reactivity at high multiplex levels. The results of this study demonstrate the suitability of this technology for comprehensive association studies that use targeted SNPs in indirect linkage disequilibrium studies or that directly screen for causative mutations.


Figures

Figure 1.
Figure 1.
Calling genotypes based on cluster analysis of raw data. Each SNP in a multiplex assay results in four fluorescent signal values: two for the two expected allele channels and two in background channels. Plotting the signal channels against each other (left) results in the formation of three clusters. The plot on the left shows 50,000 data points across several thousand markers. In order to decouple the overall signal of the particular data point from the contrast between the different allele signals, it is helpful to transform the data into a different space in which the sum of the signals in both channels (S) is plotted on the y-axis and the projection of the individual data point onto the line of constant S (the contrast value C) is plotted on the x-axis. The values of C range from -1 to 1 such that a value of -1 or 1 means signal in only one of the two channels while a value of 0 means equal signal in each channel. A one-dimensional E-M algorithm can then be used to find the clusters of homozygous and heterozygous calls. The colors have been automatically added by the cluster calling algorithm, which has identified the three clusters.
Figure 2.
Figure 2.
Schematic of the MIP assay process. MIP reactions are set up adding an enzyme mix and genomic DNA to the probe pool. This mix is then split into four tubes, each receiving a distinct nucleotide species. After gap-filling and probe inversion, inverted probes are amplified using common PCR primers. These amplicons are labeled using one of two labeling processes. In the two-color labeling scheme (top), the A and C reactions are labeled with one fluorophore while the G and T reactions are labeled with a spectrally distinct fluorophore. The A and G reactions are then pooled and hybridized to one tag array while the C and T reactions pooled and hybridized to a second array. Both arrays are then scanned using a GeneChip array scanner in two spectral channels to generate four fluorescent signals for each tag. In the four-color labeling scheme (bottom), each of the four reactions is labeled with a spectrally distinct fluorophore. All four reactions are then pooled and hybridized to a single tag array which is scanned using a GeneChip AT CCD imager in four spectral bands. In both cases four images are generated containing the four allele signals for each SNP marker.
Figure 3.
Figure 3.
The effect of clustering parameters on performance metrics. In this plot, the markers for Batch 6 are ordered along the x-axis such that the marker with the highest call rate is at the origin, while the worst performing of the ∼12,000 markers is at the right. The y-axis shows the call rate for each of these markers across 95 individuals. The markers that exhibit poor call rates are called nonconverted and are shown in the gray area. The red curve shows a choice of cluster calling parameters that emphasizes high completeness by accepting calls on the periphery of clusters. More markers show very high call rates and the amount of missing data shown by the red shaded region is minimal (99.2% completeness). The overall accuracy as measured by trio concordance shows that a small number of erroneous calls are being made (99.64% concordance). If one wishes to eliminate these incorrect calls, the base caller can be tuned to be more stringent. This choice allows very high accuracy (∼99.9% trio concordance) while causing more missing data (blue shaded region). The choice of cluster calling parameters should thus be chosen according to the intended use of the data.
Figure 4.
Figure 4.
The effect of inaccurate genotypes (A) and incomplete genotyping (B) on the number of patients required to have 80% power to find a genetic association. A genetic model has been assumed in which the relative risk of the causative allele (GRR) is two. The effect is assumed to be multiplicative. The causative allele frequency is plotted on the x-axis. The largest loss of power comes with making inaccurate calls for markers with low frequency. By contrast, incomplete data result in smaller loss of power, which is felt across the allele frequency spectrum. The data from the MIP assay are accurate enough to be used for the investigation of rare alleles without significant loss of power.

References

    1. Altshuler, D., Hirschhorn, J.N., Klannemark, M., Lindgren, C.M., Vohl, M.C., Nemesh, J., Lane, C.R., Schaffner, S.F., Bolk, S., Brewer, C., et al. 2000. The common PPARγ Pro12Ala polymorphism is associated with decreased risk of type 2 diabetes. Nat. Genet. 26: 76-80. - PubMed
    1. Cupples, L.A., Yang, Q., Demissie, S., Copenhafer, D., and Levy, D. 2003. Description of the Framingham Heart Study data for Genetic Analysis Workshop 13. BMC Genet. 4 Suppl 1: S2. - PMC - PubMed
    1. Geschwind, D.H., Sowinski, J., Lord, C., Iversen, P., Shestack, J., Jones, P., Ducat, L., and Spence, S.J. 2001. The autism genetic resource exchange: A resource for the study of autism and related neuropsychiatric conditions. Am. J. Hum. Genet. 69: 463-466. - PMC - PubMed
    1. Grossman, P.D., Bloch, W., Brinson, E., Chang, C.C., Eggerding, F.A., Fung, S., Iovannisci, D.M., Woo, S., Winn-Deen, E.S., and Iovannisci, D.A. 1994. High-density multiplex detection of nucleic acid sequences: Oligonucleotide ligation assay and sequence-coded separation. Nucleic Acids Res. 22: 4527-4534. - PMC - PubMed
    1. Hardenbol, P., Baner, J., Jain, M., Nilsson, M., Namsaraev, E.A., Karlin-Neumann, G.A., Fakhrai-Rad, H., Ronaghi, M., Willis, T.D., Landegren, U., et al. 2003. Multiplexed genotyping with sequence-tagged molecular inversion probes. Nat. Biotechnol. 21: 673-678. - PubMed

WEB SITE REFERENCES

    1. www.hapmap.org; Chromosome 12 data, HapMap Project Web site.

Publication types

MeSH terms