

A genotyping system capable of simultaneously analyzing >1000 single nucleotide polymorphisms in a haploid genome
- PMID: 15687291
- PMCID: PMC546529
- DOI: 10.1101/gr.2885205
A genotyping system capable of simultaneously analyzing >1000 single nucleotide polymorphisms in a haploid genome
Abstract
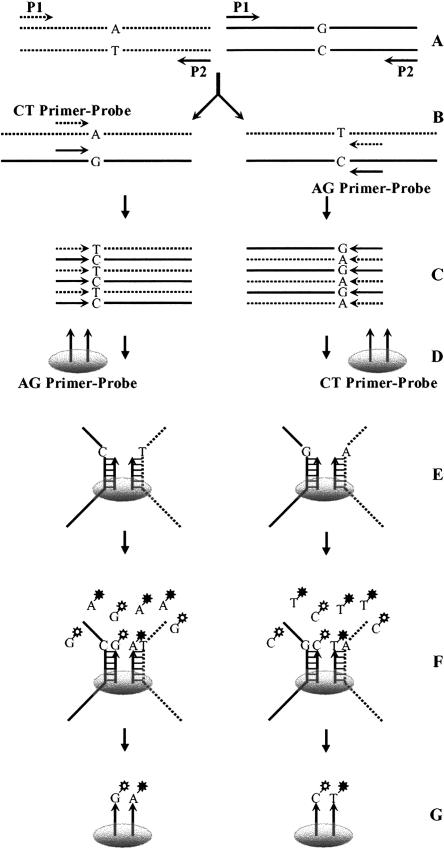
A high-throughput genotyping system for scoring single nucleotide polymorphisms (SNPs) has been developed. With this system, >1000 SNPs can be analyzed in a single assay, with a sensitivity that allows the use of single haploid cells as starting material. In the multiplex polymorphic sequence amplification step, instead of attaching universal sequences to the amplicons, primers that are unlikely to have nonspecific and productive interactions are used. Genotypes of SNPs are then determined by using the widely accessible microarray technology and the simple single-base extension assay. Three SNP panels, each consisting of >1000 SNPs, were incorporated into this system. The system was used to analyze 24 human genomic DNA samples. With 5 ng of human genomic DNA, the average detection rate was 98.22% when single probes were used, and 96.71% could be detected by dual probes in different directions. When single sperm cells were used, 91.88% of the SNPs were detectable, which is comparable to the level that was reached when very few genetic markers were used. By using a dual-probe assay, the average genotyping accuracy was 99.96% for 5 ng of human genomic DNA and 99.95% for single sperm. This system may be used to significantly facilitate large-scale genetic analysis even if the amount of DNA template is very limited or even highly degraded as that obtained from paraffin-embedded cancer specimens, and to make many unpractical research projects highly realistic and affordable.
Figures


References
-
- Brennan, M.D. 2001. High throughput genotyping technologies for pharmacogenomics. Am. J. Pharmacogenomics 1: 295-302. - PubMed
-
- Brentani, H., Caballero, O.L., Camargo, A.A., Da Silva, A.M., Da Silva Jr., W.A., Neto, E.D., Grivet, M., Gruber, A., Guimaraes, P.E., Hide, W., et al. 2003. The generation and utilization of a cancer-oriented representation of the human transcriptome by using expressed sequence tags. Proc. Natl. Acad. Sci. 100: 13418-13423. - PMC - PubMed
-
- Butcher, L.M., Meaburn, E., Liu, L., Fernandes, C., Hill, L., Al-Chalabi, A., Plomin, R., Schalkwyk, L., and Craig, I.W. 2004. Genotyping pooled DNA on microarrays: A systematic genome screen of thousands of SNPs in Large samples to detect QTLs for complex traits. Behav. Genet. 34: 549-555. - PubMed
-
- Cui, X.F., Li, H.H., Goradia, T.M., Lange, K., Kazazian Jr., H.H., Galas, D., and Arnheim, N. 1989. Single-sperm typing: Determination of genetic distance between the G γ-globin and parathyroid hormone loci by using the polymerase chain reaction and allele-specific oligomers. Proc. Natl. Acad. Sci. 86: 9389-9393. - PMC - PubMed
WEB SITE REFERENCES
-
- ftp://ftp.ncbi.nih.gov/snp/human/chr_rpts/; National Center for Biotechnology Information Human Chromosome Reports.
-
- http://www.genome.ucsc.edu/cgi-bin/hgBlat?db=hg8; University of California Santa Cruz Human BLAT Search.
-
- http://www.hapmap.org; HapMap project.
-
- http://www.ncbi.nlm.nih.gov/BLAST; National Center for Biotechnology Information BLAST Search.
-
- http://www2.umdnj.edu/lilabweb/Publications/Multiplex3G; sequences for the SNPs used in the present study.
Publication types
MeSH terms
Substances
Grants and funding
LinkOut - more resources
Full Text Sources
Other Literature Sources