. 2005 Feb 1;33(2):e21.
doi: 10.1093/nar/gni013.

Controlling gene expression in mycobacteria with anhydrotetracycline and Tet repressor

Affiliations

Controlling gene expression in mycobacteria with anhydrotetracycline and Tet repressor

Sabine Ehrt et al. Nucleic Acids Res. .

Abstract

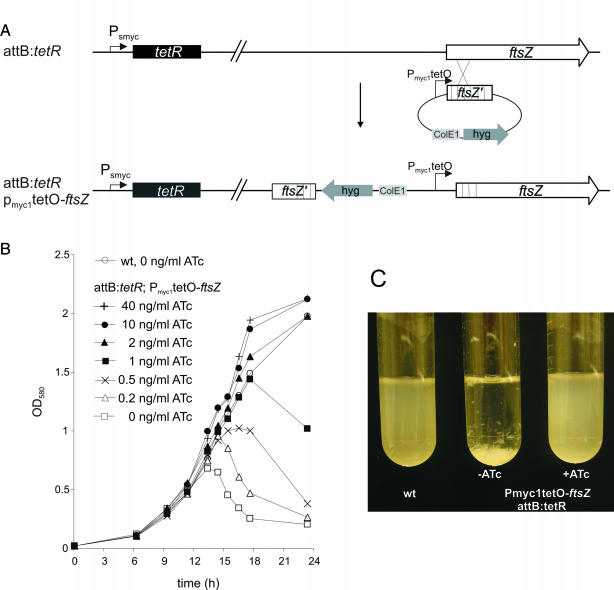
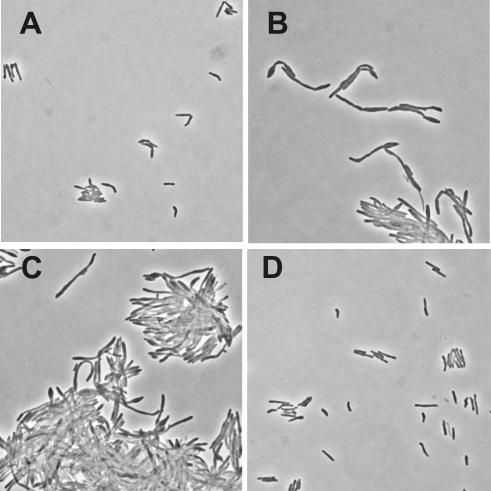
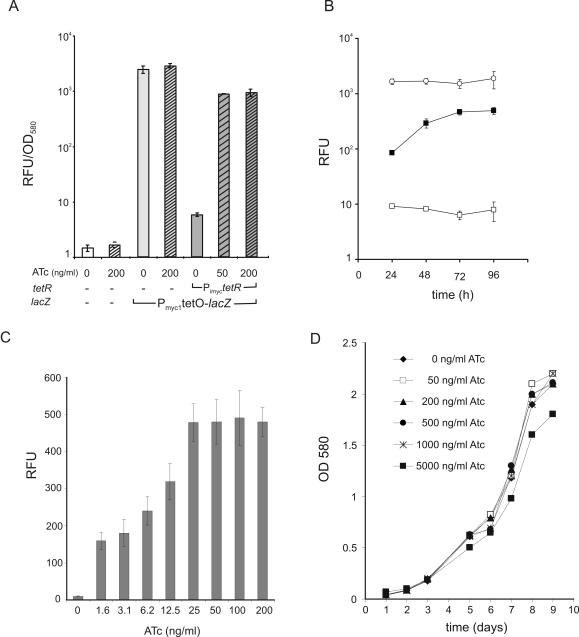
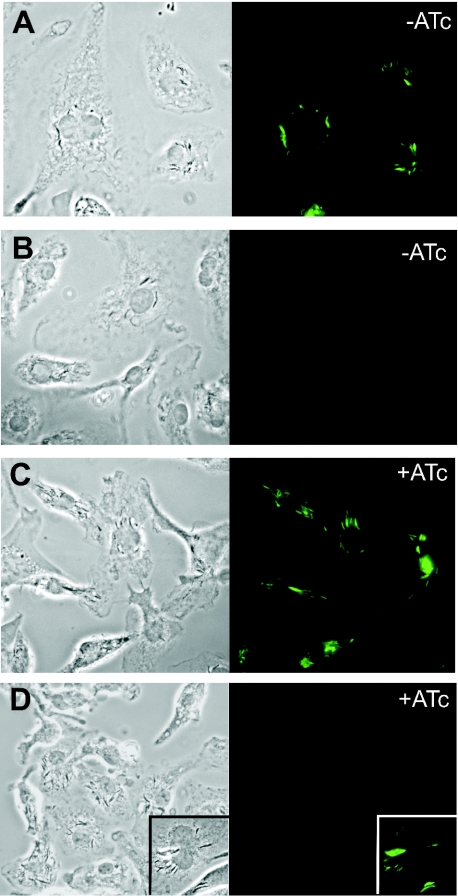
Gene expression systems that allow the regulation of bacterial genes during an infection are valuable molecular tools but are lacking for mycobacterial pathogens. We report the development of mycobacterial gene regulation systems that allow controlling gene expression in fast and slow-growing mycobacteria, including Mycobacterium tuberculosis, using anhydrotetracycline (ATc) as inducer. The systems are based on the Escherichia coli Tn10-derived tet regulatory system and consist of a strong tet operator (tetO)-containing mycobacterial promoter, expression cassettes for the repressor TetR and the chemical inducer ATc. These systems allow gene regulation over two orders of magnitude in Mycobacterium smegmatis and M.tuberculosis. TetR-controlled gene expression was inducer concentration-dependent and maximal with ATc concentrations at least 10- and 20-fold below the minimal inhibitory concentration for M.smegmatis and M.tuberculosis, respectively. Using the essential mycobacterial gene ftsZ, we showed that these expression systems can be used to construct conditional knockouts and to analyze the function of essential mycobacterial genes. Finally, we demonstrated that these systems allow gene regulation in M.tuberculosis within the macrophage phagosome.


Figures

Figure 1
Figure 1
Isolation of DNA fragments with promoter activity in M.bovis BCG. M.bovis BCG was transformed with plasmids from the promoter library or control plasmid and GFP activity was measured in log phase cultures. The eight promoters with the highest activity in M.smegmatis (data not shown) were measured in M.bovis BCG. All measurements were carried out in triplicate. The fluorescence intensity was normalized to the cell density and expressed in RFUs. Data are averages and error bars represent standard deviations.
Figure 2
Figure 2
TetR-controlled gene expression in M.smegmatis. (A) Sequence of transcriptional start point of Psmyc determined by primer extension. Primer extension reactions were performed with RNA isolated during logarithmic growth. (B) Nucleotide sequence of Psmyc and Pmyc1tetO. Putative −10 and −35 promoter consensus sequences are underlined. Tet operator sequences are indicated by boxes. (C) Effect of incorporation of Tet operator sites on Psmyc activity. The bar labeled ‘no GFP’ represents the activity of bacteria transformed with a plasmid that does not contain gfp and shows background fluorescence of the bacteria; the bar labeled ‘+GFP’ contains the gfp reporter without Psmyc or Pmyc1tetO and shows background promoter activity of the plasmid; Psmyc-GFP shows GFP activity driven by Psmyc (black bar), and Pmyc1tetO-GFP shows GFP activity driven by Pmyc1tetO (gray bar). (D) Effect of ATc and tetR expression levels on activity of Pmyc1tetO. Crosshatched bars indicate the addition of 50 ng/ml ATc. Light gray bars show constitutive Pmyc1tetO activities. Dark gray bars indicate the expression of tetR by Psmyc (strong promoter see Figure 1) and by Pimyc (intermediate strength promoter). In (D), all fluorescence intensities were corrected for background fluorescence of the bacteria. All measurements were carried out in triplicate. The fluorescence intensity was normalized to the cell density and expressed in RFUs. Data are averages and error bars represent standard deviations.
Figure 3
Figure 3
Determination of the optimal inducer concentration, growth inhibition by ATc and kinetics of induction. (A) Inducer concentration. M.smegmatis cultures transformed with plasmids carrying Pmyc1tetO-gfp and Psmyc-tetR were grown into log phase (OD580 ∼ 0.5) and increasing amounts of ATc were added. Fifteen hours later, GFP activities were determined. (B) Growth curves in the presence of ATc. M.smegmatis was grown in 7H9 medium without and with different concentrations of ATc and optical densities of the cultures were recorded every 3 h. (C) Kinetics of induction. M.smegmatis transformed with plasmids containing Pmyc1tetO-gfp (circles), Pmyc1tetO-gfp + Psmyc-tetR (squares) and Pmyc1tetO-gfp + Pimyc-tetR (triangles) were grown into log phase (OD580 ∼ 0.5), then 50 ng/ml ATc was added (t = 0) to duplicate cultures of M.smegmatis transformed with Pmyc1tetO-gfp + Pimyc-tetR (filled squares) and Pmyc1tetO-gfp + Pimyc-tetR (filled triangles). GFP activity was determined 0.5, 1, 2, 3, 4 and 5 h after the addition of ATc.
Figure 4
Figure 4
TetR controlled expression of lacZ in M.smegmatis. (A) TetR-controlled β-galactosidase activity. M.smegmatis was transformed as indicated underneath the bars. Bacteria were grown in 7H9 medium with 50 μg/ml hygromycin to an OD580 of ∼1.5. Cultures were diluted 1:100 into fresh medium without and with the addition of 50 ng/ml ATc (cross-hatched bars). After 15 h induction time, β-galactosidase activity was determined using the fluorescent substrate C2FDG. All fluorescence measurements were carried out in triplicate. The fluorescence intensity was normalized to the cell density and expressed in RFUs. Data are averages and error bars represent standard deviations. (B) Time course of TetR-controlled β-galactosidase expression. Lysates from M.smegmatis (18 μg protein) expressing lacZ with the Pmyc1tetO promoter were separated on a 9% SDS–PAGE gel. Lane 1, molecular weight marker; lane 2, constitutively expressed lacZ (no tetR); lane 3, repressed lacZ (+tetR); lanes 4–9, time course of induction of TetR-controlled lacZ by 50 ng/ml ATc. The arrow indicates the β-galactosidase protein band.
Figure 5
Figure 5
TetR-controlled regulation of ftsZ expression in M.smegmatis. (A) Strategy for construction of the conditional ftsZ knockout. A suicide plasmid was used to replace the ftsZ upstream region with Pmyc1tetO in an M.smegmatis strain that had PsmyctetR integrated in the attB site. (B) Impact of ftsZ silencing on growth of M.smegmatis. Wt M.smegmatis and the conditional ftsZ knockout were grown in the presence of 40 ng/ml ATc into the mid log phase. The cultures were washed and diluted to an OD580 of 0.02 into fresh medium without and with different concentrations of ATc (t = 0). Growth in the presence and absence of ATc was followed by measuring optical densities of the cultures. (C) Photographs of wt M.smegmatis and the conditional ftsZ knockout cultures 20 h after growth without and with 40 ng/ml ATc.
Figure 6
Figure 6
Morphology of the M.smegmatis conditional ftsZ knockout. Cultures grown in the presence or absence of ATc were examined by phase contrast microscopy with a 100× objective. (A) Wt M.smegmatis, (B, C and D) the conditional ftsZ knockout strain 9 h after removal of ATc (B), 12 h after removal of ATc (C) and in the presence of 40 ng/ml ATc (D).
Figure 7
Figure 7
TetR controlled regulation of lacZ expression in M.tuberculosis H37Rv. (A) M.tuberculosis was transformed as indicated underneath the bars. Bacteria were grown at 37°C in 7H9 medium with 10% ADNaCl enrichment and 50 μg/ml hygromycin to an OD580 of ∼0.5. Cultures were then diluted 1:5 into fresh medium without and with addition of 50 or 200 ng/ml ATc (cross-hatched bars). After 96 h induction time, β-galactosidase activity was determined using the fluorescent substrate C2FDG. All fluorescence measurements were carried out in triplicate. The fluorescence intensity was normalized to the cell density and expressed in RFUs. Data are averages and error bars represent standard deviations. (B) Kinetics of β-galactosidase induction in H37Rv. H37Rv transformed with plasmids containing Pmyc1tetO-lacZ (circles), Pmyc1tetO-lacZ + Pimyc-tetR (squares) were grown into early log phase (OD580 ∼ 0.2), then 50 ng/ml ATc was added (t = 0) to cultures of H357Rv transformed with Pmyc1tetO-lacZ + Pimyc-tetR (filled squares). β-galactosidase activities were measured after 24, 48, 72 and 96 h induction time as described in (A). (C) Concentration-response curve of β-galactosidase induction in H37Rv. TetR-controlled lacZ was induced with different concentrations of ATc for 72 h, and β-galactosidase activities were determined as described in (A). (D). Growth curves in presence of ATc. M.tuberculosis was grown in enriched 7H9 medium without and with increasing concentrations of ATc and optical densities of the cultures were recorded every 24 h.
Figure 8
Figure 8
TetR-controlled GFP expression in intraphagosomal M.tuberculosis H37Rv. Murine bone marrow-derived macrophages grown on coverslips in 24 well plates were infected with live bacteria at an MOI of 5–10 bacteria: 1 macrophage. Four hours post infection, the macrophage monolayers were washed three times with warm PBS, followed by the addition of complete tissue culture medium containing 100 μg/ml amikacin to kill extracellular bacteria. The monolayers were washed again 8 h post infection. Twenty-four hours post infection, 100 ng/ml ATc were added to wells shown in (C) and 72 h later the coverslips were analyzed by microscopy as described in Materials and Methods. The left panels depict the cell monolayers in phase contrast and the right panels show the corresponding fluorescence image. Macrophages were infected with M.tuberculosis transformed with Pmyc1tetO-GFP (A); Pmyc1tetO-GFP + Pimyc-tetR (B and C). (D) Cells that are infected with Mtb lacking GFP and treated with ATc. Samples were prepared on a different day than those shown in (A–C), but the images were acquired under the exact same conditions. The relative brightness of control samples was similar on the two different days (insert: macrophages infected with Mtb constitutively expressing GFP).

References

    1. Barnes P.F., Cave M.D. Molecular epidemiology of tuberculosis. N. Engl. J. Med. 2003;349:1149–1156. - PubMed
    1. Frieden T.R., Sterling T.R., Munsiff S.S., Watt C.J., Dye C. Tuberculosis. Lancet. 2003;362:887–899. - PubMed
    1. Kremer L., Besra G.S. Re-emergence of tuberculosis: strategies and treatment. Expert Opin. Investig. Drugs. 2002;11:153–157. - PubMed
    1. DeVito J.A., Mills J.A., Liu V.G., Agarwal A., Sizemore C.F., Yao Z., Stoughton D.M., Cappiello M.G., Barbosa M.D., Foster L.A., et al. An array of target-specific screening strains for antibacterial discovery. Nat. Biotechnol. 2002;20:478–483. - PubMed
    1. Mnaimneh S., Davierwala A.P., Haynes J., Moffat J., Peng W.T., Zhang W., Yang X., Pootoolal J., Chua G., Lopez A., et al. Exploration of essential gene functions via titratable promoter alleles. Cell. 2004;118:31–44. - PubMed

Publication types

MeSH terms

Substances