

Complex early genes
- PMID: 15687506
- PMCID: PMC548548
- DOI: 10.1073/pnas.0408355101
Complex early genes
Abstract
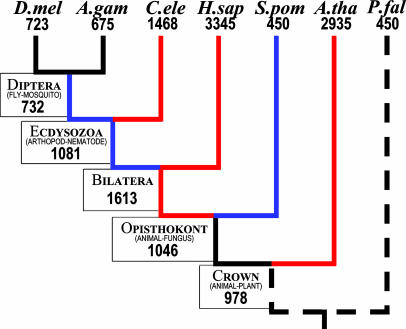
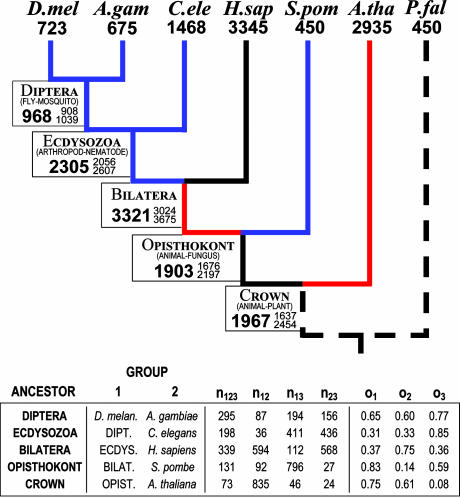
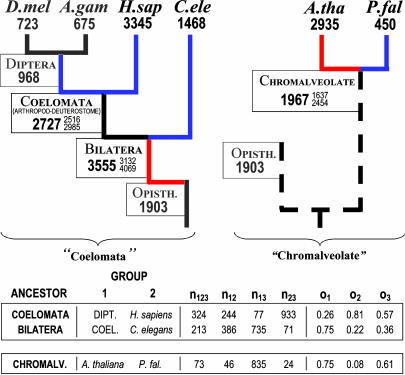
We use the pattern of intron conservation in 684 groups of orthologs from seven fully sequenced eukaryotic genomes to provide maximum likelihood estimates of the number of introns present in the same orthologs in various eukaryotic ancestors. We find: (i) intron density in the plant-animal ancestor was high, perhaps two-thirds that of humans and three times that of Drosophila; and (ii) intron density in the ancestral bilateran was also high, equaling that of humans and four times that of Drosophila. We further find that modern introns are generally very old, with two-thirds of modern bilateran introns dating to the ancestral bilateran and two-fifths of modern plant, animal, and fungus introns dating to the plant-animal ancestor. Intron losses outnumber gains over a large range of eukaryotic lineages. These results show that early eukaryotic gene structures were very complex, and that simplification, not embellishment, has dominated subsequent evolution.
Figures
References
-
- Gardner, M. J., Shallom, S. J., Carlton, J. M., Salzberg, S. L., Nene, V., Shoaibi, A., Ciecko, A., Lynn, J., Rizzo, M., Weaver, B., et al. (2002) Nature 419, 531–534. - PubMed
-
- Hall, N., Pain, A., Berriman, M., Churcher, C., Harris, B., Harris, D., Mungall, K., Bowman, S., Atkin, R., Baker, S., et al. (2002) Nature 419, 527–531. - PubMed
-
- Fast, N. M. & Doolittle, W. F. (1999) Mol. Biochem. Parasitol. 99, 275–278. - PubMed
MeSH terms
LinkOut - more resources
Full Text Sources
