. 2005 Apr;16(4):2091-105.
doi: 10.1091/mbc.e04-08-0737. Epub 2005 Feb 2.

Cholesterol and fatty acids regulate dynamic caveolin trafficking through the Golgi complex and between the cell surface and lipid bodies

Affiliations

Cholesterol and fatty acids regulate dynamic caveolin trafficking through the Golgi complex and between the cell surface and lipid bodies

Albert Pol et al. Mol Biol Cell. 2005 Apr.

Abstract

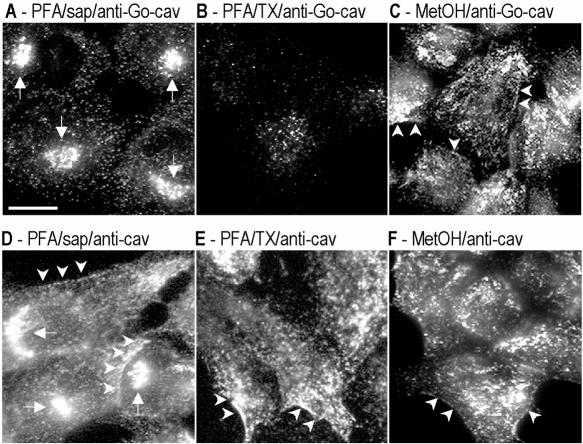
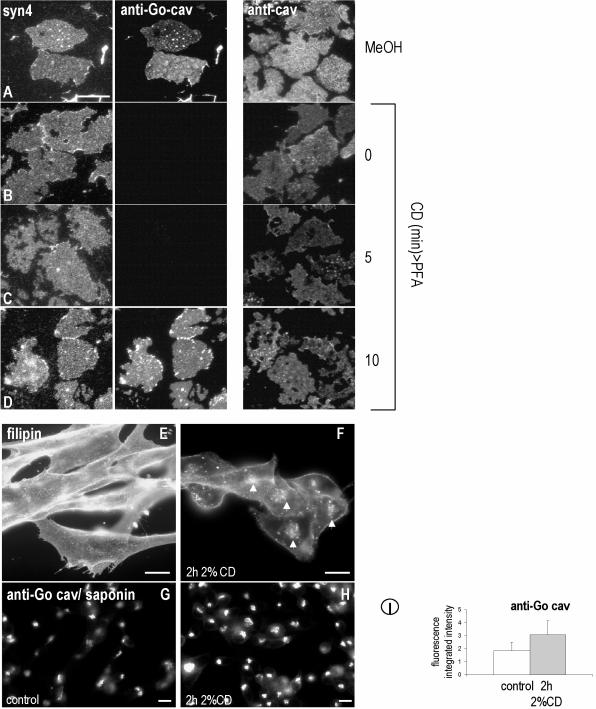
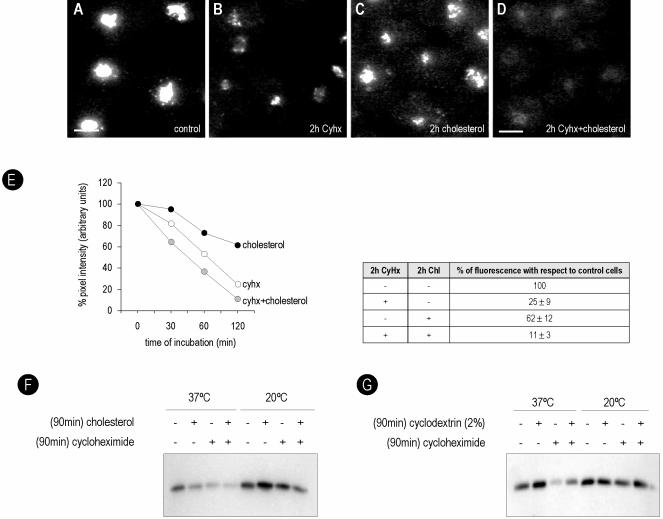
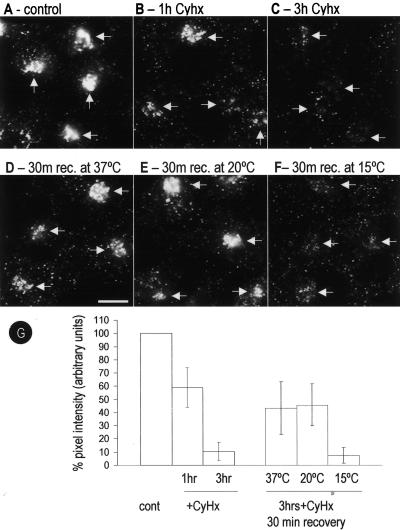
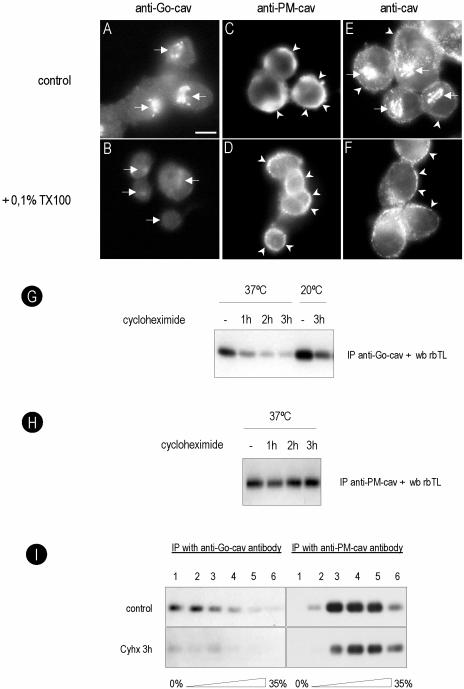
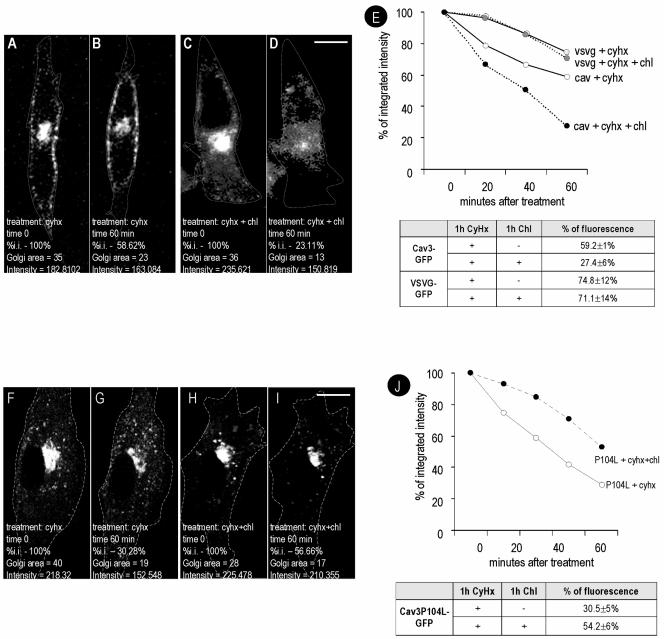
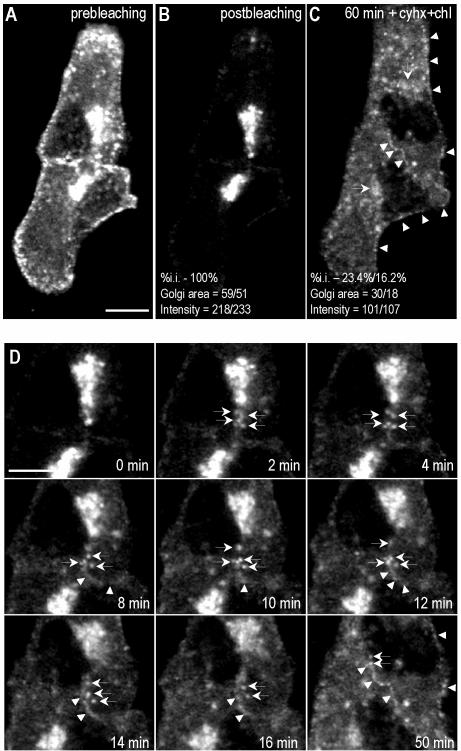
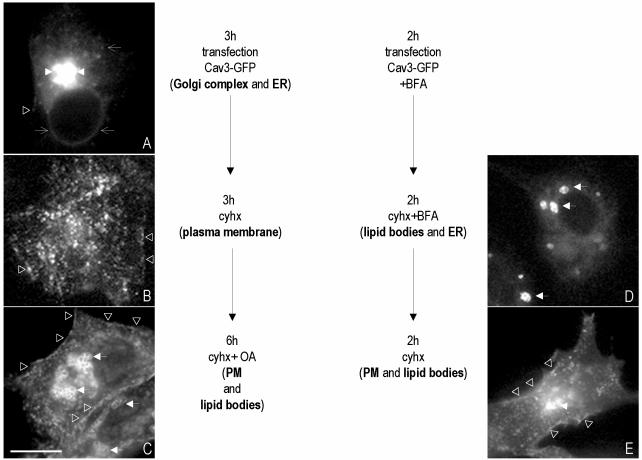
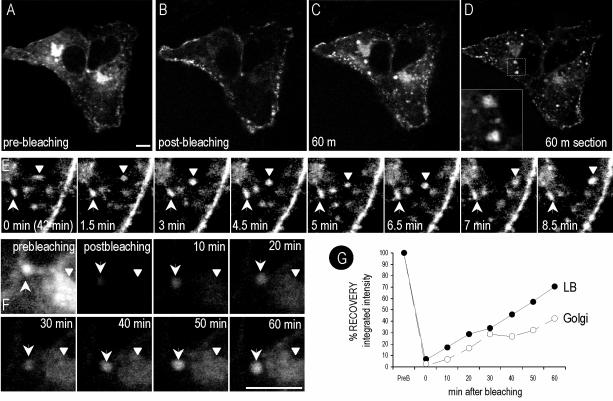
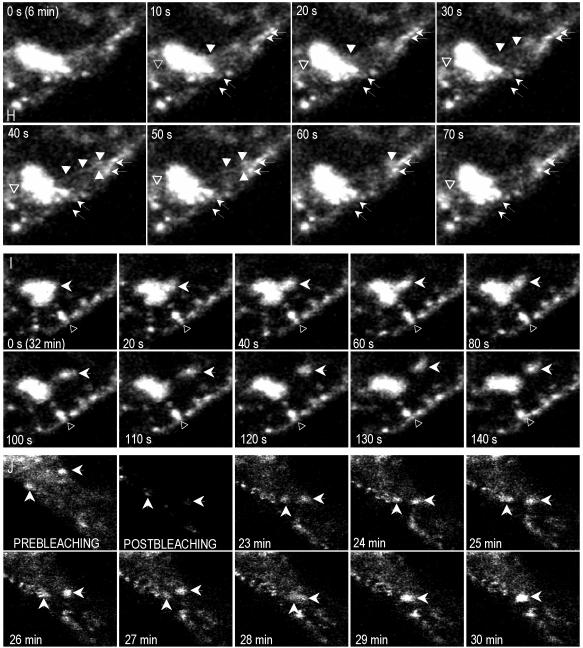
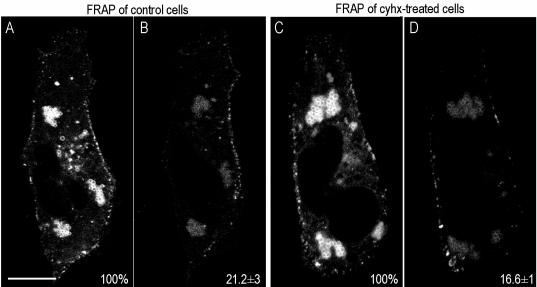
Caveolins are a crucial component of plasma membrane (PM) caveolae but have also been localized to intracellular compartments, including the Golgi complex and lipid bodies. Mutant caveolins associated with human disease show aberrant trafficking to the PM and Golgi accumulation. We now show that the Golgi pool of mainly newly synthesized protein is detergent-soluble and predominantly in a monomeric state, in contrast to the surface pool. Caveolin at the PM is not recognized by specific caveolin antibodies unless PM cholesterol is depleted. Exit from the Golgi complex of wild-type caveolin-1 or -3, but not vesicular stomatitis virus-G protein, is modulated by changing cellular cholesterol levels. In contrast, a muscular dystrophy-associated mutant of caveolin-3, Cav3P104L, showed increased accumulation in the Golgi complex upon cholesterol treatment. In addition, we demonstrate that in response to fatty acid treatment caveolin can follow a previously undescribed pathway from the PM to lipid bodies and can move from lipid bodies to the PM in response to removal of fatty acids. The results suggest that cholesterol is a rate-limiting component for caveolin trafficking. Changes in caveolin flux through the exocytic pathway can therefore be an indicator of cellular cholesterol and fatty acid levels.


Figures

Figure 1.
Figure 1.
Specific antibodies show affinity for different pools of caveolin. BHK cells were processed for immunofluorescence microscopy by using different fixation (PFA/methanol) and permeabilization (saponin/TX-100) protocols. Caveolin distribution was analyzed with two different polyclonal antibodies: anti-Go-cav antibody (A–C) and anti-cav antibody (D–F). Golgi-associated caveolin was detected with both antibodies in cells fixed with PFA and permeabilized with saponin (A and D) but not in cells fixed in methanol (C and F) or permeabilized with Triton X-100 (B and E). PM-associated caveolin was detected for anti-caveolin antibody in all three experimental conditions (D–F). The anti-Go-caveolin antibody only detected the PM-associated caveolin when the cells were fixed with methanol (C) but not PFA (A and B). In total, six antibodies were tested. See Table 1 for a summary of the results and details of antibodies and protocols. Bar, 5 μm.
Figure 2.
Figure 2.
Cholesterol depletion reveals specific epitopes of caveolin. Plasma membrane sheets were prepared from 3T3-L1 adipocytes and fixed immediately in MeOH (A) or PFA (B) or incubated in 0.4% CD for 5 min (C) or 10 min (D) before PFA fixation. Membranes were single-labeled using anti-cav or double-labeled using anti-Go-cav and anti-syntaxin4. Anti-cav recognized caveolin on the PM in both PFA- and MeOH-fixed membranes. Anti-Go-cav recognized caveolin on the PM only when the membranes were fixed with MeOH (E) or extracted with CD for 10 min before fixation with PFA (D), whereas anti-Syn4 labeled both PFA- and MeOH-fixed membranes. (E–I) BHK were treated for 2 h with 2% CD, and the distribution of cholesterol was studied by means of filipin (F). Even after 2 h, surface cholesterol was still visible (compare E with F). After the CD treatment, and in contrast to the results obtained for plasma membrane sheets, anti-Go-cav do not recognized caveolin on the PM (H); however, a stronger caveolin labeling of the Golgi complex was observed (compare H with G). (I) The relative fluorescence associated with caveolin in the Golgi-complex was quantified in control and CD-treated cells. CD-treated cells showed an increase of 65% in Golgi caveolin-associated fluorescence. Bar, 5 μm.
Figure 5.
Figure 5.
Cholesterol modulates caveolin traffic through the Golgi complex. BHK cells were incubated for 2 h in a medium enriched in cholesterol (C), with CyHx (B) or with both (D). The Golgi-associated caveolin was monitored by means of anti-Go-cav antibody. In the presence of elevated cholesterol, the rate of decrease in the Golgi caveolin pool observed after treatment with Cyhx was accelerated from 25 ± 9 to 11 ± 3% (D and E for quantification). (F and G) Cells were incubated for 90 min with cholesterol or cyclodextrin, Cyhx, or both, and detergent-soluble caveolin was immunoprecipitated by anti-Go-cav antibody. Less caveolin was precipitated from cells treated with cholesterol. However, few changes in the amount of caveolin were observed when the Golgi exit was blocked at 20°C. (G) In contrast, more caveolin was immunoprecipitated from cells treated with 2% CD. Bar, 5 μm.
Figure 3.
Figure 3.
Golgi-associated caveolin predominantly corresponds to newly synthesized protein. BHK cells were incubated for different times with Cyhx (a general inhibitor of protein translation), and the Golgi-associated pool of caveolin was monitored by means of an anti-Go-cav antibody. The amount of caveolin present in the Golgi complex was quantified as percentage of pixel intensity with respect to control cells (G). A reduction to 59± 16 or 10 ± 8% in the amount of caveolin was detected after 1 h (B) or 3 h (C), respectively. Next, the cells were incubated for 3 h with Cyhx, and the drug was washed out, allowing the cells to recover. After 30 min at 37°C, 43 ± 12% of caveolin reappeared in a the Golgi complex (D). The recovery was completely blocked at 15°C (7 ± 1%) (F) but unaffected at 20°C (46 ± 14%) (E). Bar, 5 μm.
Figure 4.
Figure 4.
Golgi caveolin is detergent soluble and forms low-molecular-weight oligomers. BHK cells were extracted for 2 min at 4°C with a buffer containing 0.1% TX-100, fixed in PFA, and caveolin was detected with an anti-Go-cav or an anti-PM-cav antibody. The Golgi pool of caveolin was completely extracted by the detergent (compare A and B or E and F), but the PM pool was largely unaffected (compare C and D or E and F). In G, BHK cells were treated for 1, 2, or 3 h with Cyhx at 37 or 20°C, extracted for 2 min at 4°C with a buffer containing 0.1% TX-100, and the soluble fraction was immunoprecipitated with anti-Go-cav antibody. The amount of caveolin decreased progressively in response to Cyhx, and little protein was detected after 3 h. When the cells were incubated at 20°C, the amount of caveolin immunoprecipitated increased. At 20°C, no effect was observed in response to Cyhx consistent with retention in the Golgi complex. No changes in response to Cyhx were observed with an anti-PM-cav antibody (H). (I) Control cells or cells treated for 3 h with Cyhx were extracted with 0.1% TX-100, and the different molecular weight oligomers of caveolin were fractionated using a sucrose gradient (see Materials and Methods for details). Fractions of the gradient were immunoprecipitated using anti-Go-cav or anti-PM-cav. The anti-Go-cav antibody recognized predominantly low-molecular-weight oligomers of the protein (fractions 1 and 2 of the gradient), but the anti-PM-cav antibody exclusively recognized the high-molecular-weight caveolin complexes (fractions 3–5). In contrast to the PM pool of the protein, Golgi caveolin was sensitive to Cyhx. Bar, 5 μm.
Figure 6.
Figure 6.
Cholesterol increases transport through the Golgi complex of caveolin but not of VSV-G. BHK cells were transfected with Cav3-GFP for 6 h or with VSV-G-GFP induced at 31°C for 3 h. Cells were selected for the presence of the protein in the Golgi area. Next, Cyhx/cholesterol was added to the media. The focus of the microscope was then kept constant during the rest of the experiment. Images were captured every 1 min during 60 min and processed equally to calculate the integrated intensity (the product of the area and the average pixel intensity) (see representative experiment in A–D and average of 6 independent experiments in E). After 1 h, Cav1 levels were reduced to 59 ± 10% in response to Cyhx (compare B with A) and to 27 ± 6% in response to Cyhx/cholesterol (compare D with C and see E for the complete time course). In contrast, no significant differences were observed in the levels of Golgi associated VSV-G after 1 h with Cyhx (75 ± 12%) or with Cyhx/cholesterol (71 ± 14%) (E). (F–J) Cells were transfected with Cav3P104L-GFP and treated with Cyhx or with a combination of Cyhx and cholesterol as described previously (see representative experiment in F–I and average of 6 independent experiments in J). In contrast to the wild-type protein, cholesterol addition retarded the loss of the mutant Cav3P104L-GFP from the Golgi complex (from 30.5 ± 5 to 54.2 ± 6%). Bar, 5 μm.
Figure 7.
Figure 7.
FRAP of Golgi-associated caveolin. Cav3-GFP was transfected into Vero cells. After 16 h, the fluorescence of selected cells (A) was photobleached excluding the Golgi area (B), and then incubated with Cyhx and cholesterol for 1 h (see Video 1). Frames were taken every 10s. Within the first minutes after the photobleaching, numerous vesicles were observed budding from the Golgi complex and trafficking toward the PM (D). Fluorescence at the PM recovered during the experiment (C and D, arrowheads), but Golgi pool of caveolin decreased to 20 ± 5% (C and D). Bar, 5 μm.
Figure 8.
Figure 8.
(A–C) Caveolin cycle. (A) BHK cells were transfected with Cav3-GFP for 3 h. (B) Next, the transfection medium was replaced by a medium containing Cyhx, and the cells were incubated for an additional 3 h. (C) Finally, 50 μg/ml oleic acid was added for 6 h. (D and E) BHK cells were transfected with Cav3-GFP for 2 h in the presence of 5 μg/ml BFA. Next, the transfection medium was replaced by medium that contained Cyhx and BFA for an additional 2 h (D). Finally, BFA was washed out, and the cells were further incubated in a media containing Cyhx for 2 h (E). Bar, 5 μm.
Figure 9.
Figure 9.
Time-lapse videomicroscopy and FRAP of LB-associated caveolin. Vero cells were transfected with Cav3-GFP for 16 h (A), after photobleaching of the cell, except the PM (see example in B) images were captured every 10 s for a total period of 60 min. Caveolin containing LBs usually aggregated forming grape-like structures (C, confocal section D, and Video 2). Some LBs showed a short-range rotary movement (E, arrows, and Video 4), whereas others showed a long-range movement underneath the PM (E, arrowheads, and Video 4). After photobleaching, LBs recovered rapidly and often reached half of the original intensity in <1 h (F and G and Video 2). We also noted the budding of tubules from LBs that apparently contacted the PM (H and Video 3), shuttling of small/group of LBs from larger LBs (I and Video 3), and possible fusion processes between LBs (J and Video 2). Bar, 2 μm.
Figure 9.
Figure 9.
Time-lapse videomicroscopy and FRAP of LB-associated caveolin. Vero cells were transfected with Cav3-GFP for 16 h (A), after photobleaching of the cell, except the PM (see example in B) images were captured every 10 s for a total period of 60 min. Caveolin containing LBs usually aggregated forming grape-like structures (C, confocal section D, and Video 2). Some LBs showed a short-range rotary movement (E, arrows, and Video 4), whereas others showed a long-range movement underneath the PM (E, arrowheads, and Video 4). After photobleaching, LBs recovered rapidly and often reached half of the original intensity in <1 h (F and G and Video 2). We also noted the budding of tubules from LBs that apparently contacted the PM (H and Video 3), shuttling of small/group of LBs from larger LBs (I and Video 3), and possible fusion processes between LBs (J and Video 2). Bar, 2 μm.
Figure 10.
Figure 10.
Caveolin cycles between the PM and intracellular lipid bodies. Vero cells were transfected with Cav3-GFP for 24 h in the presence of 50 μg/ml oleic acid. After photobleaching of the cell except the PM, images were captured every 1 min for a total period of 60 min (Videos 5 and 6). Photobleached LBs recovered 21 ± 3 of the original fluorescence within 1 h (A and B), even in the presence of Cyhx (17 ± 1, C and D). Bar, 5 μm.

Similar articles

Cited by

References

    1. Bist, A., Fielding, C. J., and Fielding, P. E. (2000). p53 regulates caveolin gene transcription, cell cholesterol, and growth by a novel mechanism. Biochemistry 39, 1966-1972. - PubMed
    1. Bist, A., Fielding, P. E., and Fielding, C. J. (1997). Two sterol regulatory element-like sequences mediate up-regulation of caveolin gene transcription in response to low density lipoprotein free cholesterol. Proc. Natl. Acad. Sci. USA 94, 10693-10698. - PMC - PubMed
    1. Bradford, M. M. (1976). A rapid and sensitive method for the quantitation of microgram quantities of protein utilizing the principle of protein-dye binding. Anal. Biochem. 72, 248-254. - PubMed
    1. Dundr, M., Hoffmann-Rohrer, U., Hu, Q., Grummt, I., Rothblum, L. I., Phair, R. D., and Misteli, T. (2002). A kinetic framework for a mammalian RNA polymerase in vivo. Science 298, 1623-1626. - PubMed
    1. Dupree, P., Parton, R. G., Raposo, G., Kurzchalia, T. V., and Simons, K. (1993). Caveolae and sorting in the trans-Golgi network of epithelial cells. EMBO J. 12, 1597-1605. - PMC - PubMed

Publication types

MeSH terms