. 2005 Apr;16(4):2003-17.
doi: 10.1091/mbc.e04-06-0442. Epub 2005 Feb 2.

Ace2p controls the expression of genes required for cell separation in Schizosaccharomyces pombe

Affiliations

Ace2p controls the expression of genes required for cell separation in Schizosaccharomyces pombe

Maria Luisa Alonso-Nuñez et al. Mol Biol Cell. 2005 Apr.

Abstract

Schizosaccharomyces pombe cells divide by medial fission through contraction of an actomyosin ring and deposition of a multilayered division septum that must be cleaved to release the two daughter cells. Here we describe the identification of seven genes (adg1(+), adg2(+), adg3(+), cfh4(+), agn1(+), eng1(+), and mid2(+)) whose expression is induced by the transcription factor Ace2p. The expression of all of these genes varied during the cell cycle, maximum transcription being observed during septation. At least three of these proteins (Eng1p, Agn1p, and Cfh4p) localize to a ring-like structure that surrounds the septum region during cell separation. Deletion of the previously uncharacterized genes was not lethal to the cells, but produced defects or delays in cell separation to different extents. Electron microscopic observation of mutant cells indicated that the most severe defect is found in eng1Delta agn1Delta cells, lacking the Eng1p endo-beta-1,3-glucanase and the Agn1p endo-alpha-glucanase. The phenotype of this mutant closely resembled that of ace2Delta mutants, forming branched chains of cells. This suggests that these two proteins are the main activities required for cell separation to be completed.


Figures
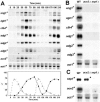
Figure 1.
Figure 1.
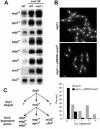
Transcription of Ace2-dependent genes. (A). Expression during the cell cycle. Synchrony was induced by arrest-release of a cdc25-22 mutant (PPG148), and samples were taken at the indicated time points (minutes) after the release for RNA extraction. RNA blots were probed with specific probes for eng1+, agn1+, cfh4+, adg1+, adg2+ adg3+, and ace2+, using act1+ as a loading control. The graph represents the anaphase index (○) or septation index (•) at each time point. In this experiment, the peak of septum formation occurred at 70–90 min. The anaphase index was determined by counting the percentage of anaphase cells (cells with two nuclei and without a septum) after DAPI staining. The septation index was determined by counting the percentage of cells with septum after calcofluor staining. (B) Expression of target genes in ace2Δ and sep1Δ strains. RNA was extracted from wild-type (h123), ace2Δ (LE25), or sep1Δ (A131) strains during exponential growth. After transfer to nitrocellulose membranes, RNA blots were sequentially hybridized with specific probes (prepared by PCR amplification of specific DNA fragments) for eng1+, agn1+, cfh4+, adg1+, adg2+, and adg3+, using act1+ as loading control. (C) Expression of ace2+ and sep1+ in ace2Δ and sep1Δ strains. RNA was extracted from wild-type (h123), ace2Δ (LE25), or sep1Δ (A131) strains during exponential growth. After transfer to nitrocellulose membranes, RNA blots were sequentially hybridized with specific probes (prepared by PCR amplification of specific DNA fragments) for sep1+ and ace2+, using act1+ as loading control.
Figure 2.
Figure 2.
Relationship between Ace2p and Sep1. (A) Overexpression of ace2+ restores transcription in sep1Δ cells. RNA was extracted from wild-type (h123) or sep1Δ (A131) strains carrying pREP3X-ace2+ grown for 22 h in the absence of thiamine (ace2 OE). The wild-type strain carrying empty vector grown under the same conditions (first lane) was used to determine the endogenous transcript levels. After transfer to nitrocellulose membranes, RNA blots were sequentially hybridized with specific probes for eng1+, agn1+, adg1+, adg2+, adg3+, cfh4+, and ace2+, using his3+ as loading control. (B) Moderate ace2+ overexpression complements the cell separation defect of sep1Δ cells. Representative microscopic images of the sep1Δ mutant (top) or the sep1Δ mutant carrying pREP81X-ace2+ (middle) are shown. Quantitation of the percentage of septa in both cultures is shown in the bottom panel. Cells were stained with aniline blue and DAPI before counting. For each sample, 200 cells of were counted. (C) Model depicting transcriptional regulation during the last stages of the S. pombe cell cycle.
Figure 3.
Figure 3.
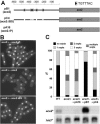
The consensus sequence TGTTTAC is important for ace2+ function. (A) Schematic representation of the position of the five copies of the TGTTTAC sequence in the ace2+ promoter and the constructs used. Plasmid pB1 contains the wild-type ace2+ promoter upstream of the ace2+ ORF (ace2), plasmid pC4 contains the ace2+ promoter in which the five copies of the TGTTTAC sequence were deleted (ace2ΔBS) and pA16 carries the ace2+ ORF without promoter (ace2ΔP). The arrow indicates the orientation of the TGTTTAC sequence. (B) Representative microscopic images of the ace2Δ mutants carrying ace2ΔP (top), ace2 (middle), or ace2ΔBS (bottom) are shown. (C) Quantification of the percentage of septa in wild-type, ace2Δ mutants and ace2Δ mutants containing ace2ΔP (pA16), ace2 (pB1) or ace2ΔBS (pC4). Cells were stained with aniline blue and DAPI before counting. For each sample, 200 cells of were counted. The bottom panel shows the expression of the ace2+ gene in wild-type (WT), ace2Δ mutants (ace2Δ), or ace2Δ mutants containing ace2ΔP (pA16), ace2 (pB1), or ace2ΔBS (pC4). The his3+ gene was used as loading control.
Figure 4.
Figure 4.
Effects of ace2 levels on protein abundance of microarray targets. Protein lysates were prepared from wild-type untagged control strain KGY 246, adg1-GFP (KGY 4397), agn1-GFP (KGY 4398), adg2-GFP (KGY 4390), eng1-GFP (KGY 4387), adg3-GFP (KGY 4399), cfh4-GFP (KGY 4386) cells carrying a WT copy of ace2+ (WT); cells overexpressing ace2+ from the nmt1 promoter of pREP3X (ace2oe) or lacking ace2+ (ace2Δ): adg1-GFP ace2Δ (KGY 4612), agn1-GFP ace2Δ (KGY 4614), adg2-GFP ace2Δ (KGY 4616), eng1-GFP ace2Δ (KGY 4618), adg3-GFPace2Δ (KGY 4621) cfh4-GFPace2Δ (KGY 4620). Immunoprecipitates of adg2-GFP (top right panel) and cfh4-GFP (bottom right panel) were resolved on a 3–8% Tris-acetate gel. Immunoblotting was performed using the Odyssey Infrared Imaging System (Cincinnati, OH) and protocols (LI-COR). Primary anti-GFP serum was used at 1:1000 concentration. Goat anti-rabbit Alexa680 (LI-COR) was used at 1:5000 dilution. Image files were exported from the Odyssey software in TIFF format. The rest of the immunoprecipitates were resolved on a 4–12% Bis-Tris gel, immunoblotted with anti-GFP serum, and visualized by ECL.
Figure 5.
Figure 5.
Relationship between Ace2p and the SIN network. cdc7–24 (KGY2061) cells, grown at 25°C, were synchronized in early G2 phase by centrifugal elutriation. Cells were then filtered and placed in medium prewarmed to 36°C. Samples were collected every 20 min, beginning 30 min after the shift. RNA was extracted from cell pellets, and Northern analysis was used to determine the level of eng1+ mRNA. The levels of cdc22+ mRNA were used to demonstrate cell cycle progress, and his3+ mRNA was used as a loading control. A small sample of cells from each time point was also fixed in ethanol and then stained with DAPI to determine the number of nuclei. The same RNA samples were utilized to determine the levels of other mRNAs in a separate study (Petit et al., unpublished results).
Figure 6.
Figure 6.
Localization of Ace2p targets. Confocal images of the indicated strains, eng1-GFP (KGY4387), agn1-GFP (KGY4398), and cfh4-GFP (KGY4386). Cells were grown to midlog phase, and live cell images were obtained.
Figure 7.
Figure 7.
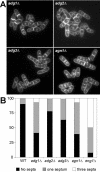
Phenotype of mutants lacking Ace2p target genes. (A) Microscopic appearance of adg1Δ (YMAN2), adg2Δ (YMAN5), adg3Δ (YMAN4), and agn1Δ (YAB53) deletion mutants. Cells were grown in rich medium (YES), washed, and stained with aniline blue and DAPI before photographs were taken. (B) Number of septa in wild-type, adg1Δ (YMAN2), adg2Δ (YMAN5), adg3Δ (YMAN4), agn1Δ (YAB53), and eng1Δ (YAB14) mutants. More than 300 cells were counted for each strain.
Figure 8.
Figure 8.
Phenotype of different double mutants. (A) Number of septa in wild-type (h123), adg1Δ adg3Δ (YMAN7), adg1Δ adg2Δ (YMAN25), adg2Δ adg3Δ (YMAN26), and eng1Δ agn1Δ (YAB54) mutants. More than 300 cells were counted for each strain. (B) Microscopic appearance of eng1Δ adg3Δ (YMAN11) mutant cells. Cells were grown in rich medium (YES), washed, and stained with Calcofluor. Photographs of differential interference contrast microscopy (DIC) or Calcofluor-stained cells (CF) are shown. (C) Electron microscopy ultrastructure of wild-type (top panel) and eng1Δ adg3Δ (YMAN7) mutant cells (middle and bottom panels). The arrowhead marks the uncleaved primary septum, and asterisks indicate points of lateral growth. Scale bars, (top and middle) 1 μm; (bottom) 0.5 μm.
Figure 9.
Figure 9.
eng1Δ agn1Δ cells are defective in cell separation. Morphology of ace2Δ (LE25, A) and eng1Δ agn1Δ (YAB54, B) cells. (C–E) Magnifications of representative groups of ace2Δ (D) and eng1Δ agn1Δ (E) cells, with the wild-type (C) as control. Cells were grown in rich medium to early-log phase, fixed with ethanol, and stained with aniline blue and DAPI. eng1Δ agn1Δ mutants show a mycelial and branched phenotype, similar to ace2Δ mutants, although the cells are less elongated. Scale bar, 10 μm.
Figure 10.
Figure 10.
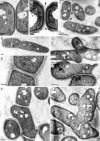
Electron microscopy ultrastructure of wild-type and mutant cells. Wild-type (A), eng1Δ (B), agn1Δ (C), eng1Δ agn1Δ (D–F), and ace2Δ (G–I) cells were grown to midlog phase before preparation for electron microscopy. The septum region of eng1Δ mutants (B) shows the presence of uncleaved primary septum (arrowheads). In agn1Δ mutants, the primary septum is degraded, but some cells remain attached by the cell wall at one of the ends (C, arrowheads). Double eng1Δ agn1Δ mutants grew as branched filaments, in which the septum was not cleaved (D–F). ace2Δ shows similar defects in cell separation, forming branching filaments of cells (G–I). The rectangles in D and G indicate the region magnified in E and H, respectively. The seemingly abnormal shape of cells (F and I) is the consequence of their different spatial positions in the branched filaments. Scale bars, 0.5 μm (A, B, E, and H) or 1 μm (C, D, F, G, and I).

Similar articles

Cited by

References

    1. Bähler, J., and Nurse, P. (2001). Fission yeast Pom1p kinase activity is cell cycle regulated and essential for cellular symmetry during growth and division. EMBO J. 20, 1064-1073. - PMC - PubMed
    1. Bähler, J., and Pringle, J. R. (1998). Pom1p, a fission yeast protein kinase that provides positional information for both polarized growth and cytokinesis. Genes Dev. 12, 1356-1370. - PMC - PubMed
    1. Bähler, J., Steever, A. B., Wheatley, S., Wang, Y., Pringle, J. R., Gould, K. L., and McCollum, D. (1998a). Role of polo kinase and Mid1p in determining the site of cell division in fission yeast. J. Cell Biol. 143, 1603-1616. - PMC - PubMed
    1. Bähler, J., Wu, J. Q., Longtine, M. S., Shah, N. G., McKenzie, A., Steever, A. B., Wach, A., Philippsen, P., and Pringle, J. R. (1998b). Heterologous modules for efficient and versatile PCR-based gene targeting in Schizosaccharomyces pombe. Yeast 14, 943-951. - PubMed
    1. Baladrón, V., Ufano, S., Dueñas, E., Martín-Cuadrado, A. B., Rey, F.D., and Vázquez de Aldana, C. R. (2002). Eng1p, an endo-1,3-β-glucanase localized at the daughter side of the septum, is involved in cell separation in Saccharomyces cerevisiae. Eukaryot. Cell 1, 774-786. - PMC - PubMed

Publication types

MeSH terms

Substances