. 2005 Mar;14(3):644-52.
doi: 10.1110/ps.041107205. Epub 2005 Feb 2.

Structural features of the focal adhesion kinase-paxillin complex give insight into the dynamics of focal adhesion assembly

Affiliations

Structural features of the focal adhesion kinase-paxillin complex give insight into the dynamics of focal adhesion assembly

Craig M Bertolucci et al. Protein Sci. 2005 Mar.

Abstract

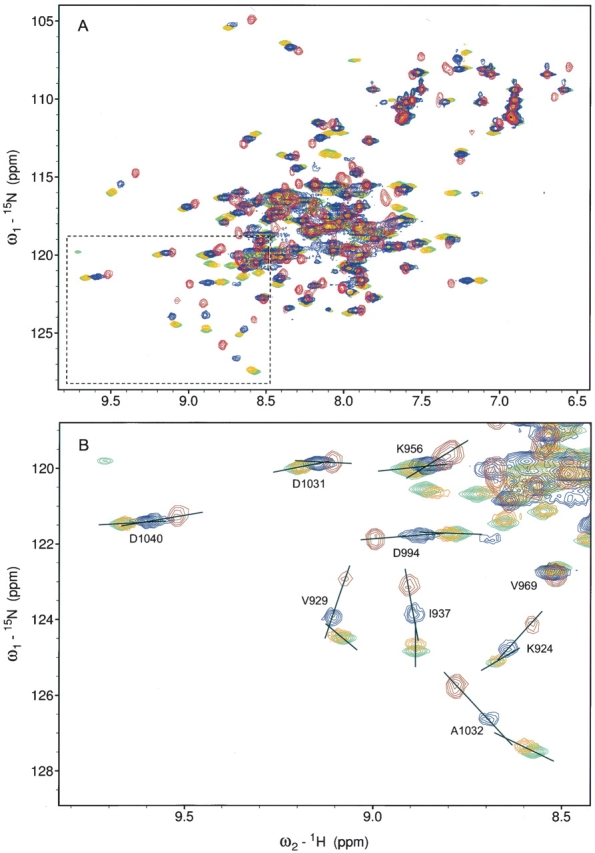
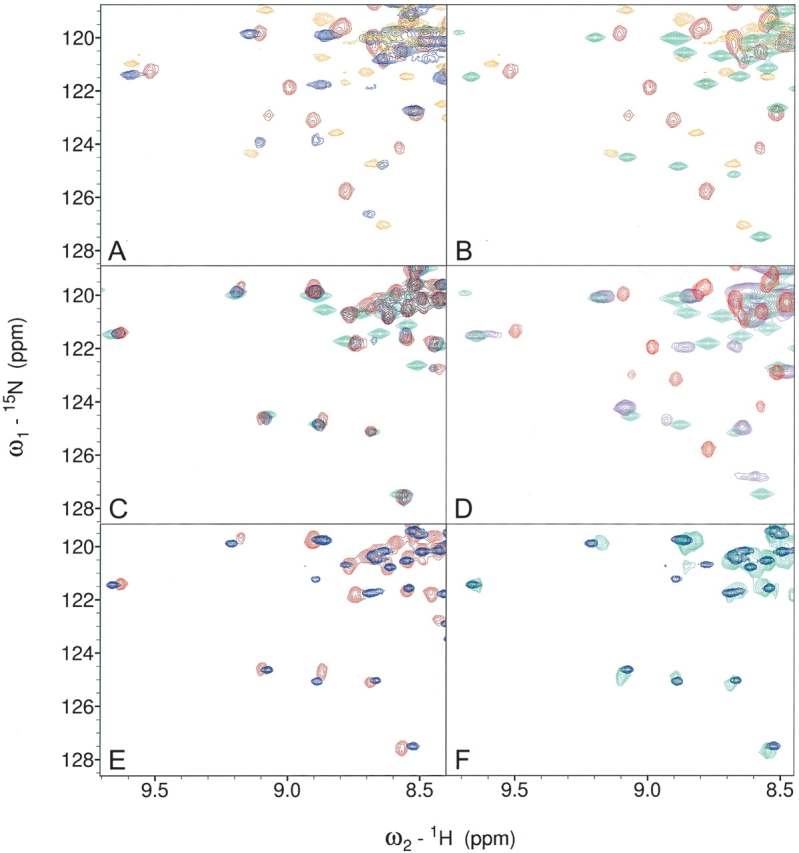
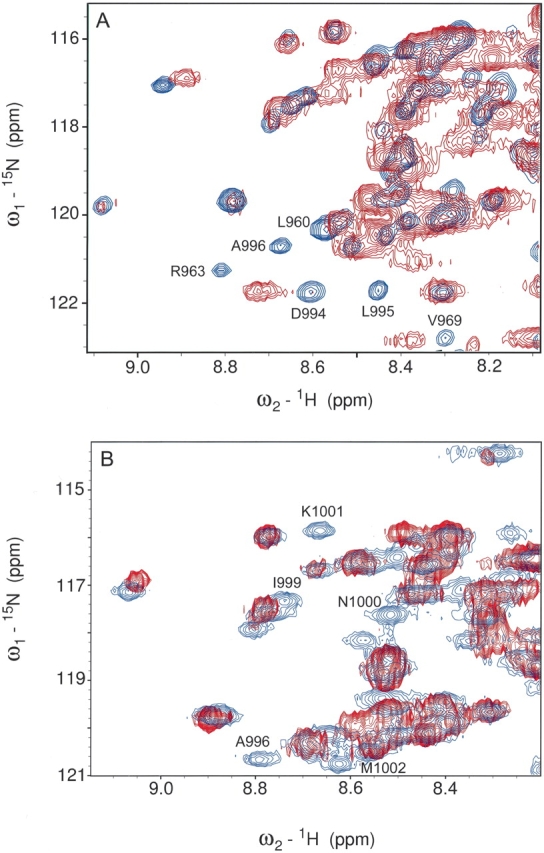
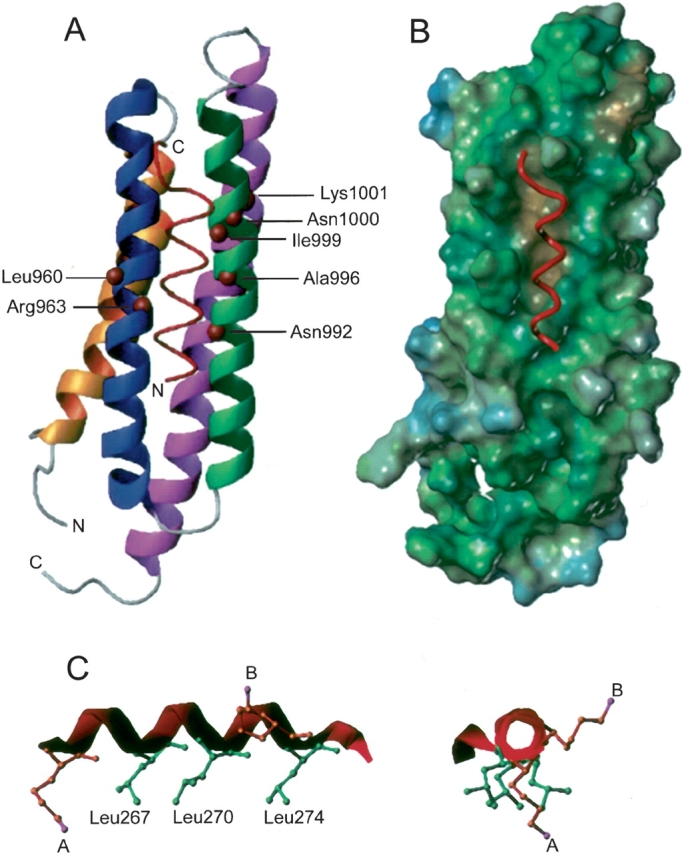
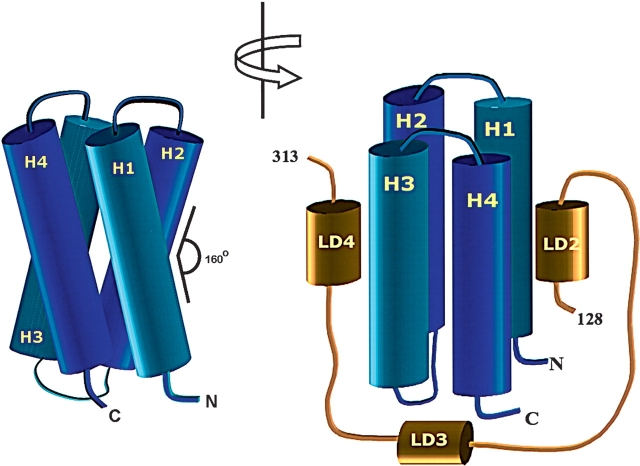
The C-terminal region of focal adhesion kinase (FAK) consists of a right-turn, elongated, four-helix bundle termed the focal adhesion targeting (FAT) domain. The structure of this domain is maintained by hydrophobic interactions, and this domain is also the proposed binding site for the focal adhesion protein paxillin. Paxillin contains five well-conserved LD motifs, which have been implicated in the binding of many focal adhesion proteins. In this study we determined that LD4 binds specifically to only a single site between the H2 and H3 helices of the FAT domain and that the C-terminal end of LD4 is oriented toward the H2-H3 loop. Comparisons of chemical-shift perturbations in NMR spectra of the FAT domain in complex with the binding region of paxillin and the FAT domain bound to both the LD2 and LD4 motifs allowed us to construct a model of FAK-paxillin binding and suggest a possible mechanism of focal adhesion disassembly.


Figures

Figure 1.
Figure 1.
HSQC map of LD2 titration into a solution containing the FAT domain. (A) Overlaid HSQC spectra of the FAT domain (red), FAT with 1 eq of LD2 (blue), FAT with 2 eq of LD2 (orange), and FAT with 10 eq of LD2 (green). (B) Expanded region in A shows changes in the direction of the chemical shifts indicating a secondary binding event.
Figure 2.
Figure 2.
HSQC map of LD4 titration into a solution containing the FAT domain. (A) Overlaid HSQC spectra of the FAT domain (red), FAT with 1 eq of LD4 (orange), and FAT with 10 eq of LD4 (green). (B) Comparison of the HSQC spectra of FAT with 1 eq of LD2 (blue) and with 1 eq of LD4 (red). The difference in the spectra indicates that the two peptides bound to different sites in FAT.
Figure 3.
Figure 3.
HSQC fingerprints of FAT–LD complexes. The spectra shown are the “fingerprint” regions that highlight the differences between the FAT domain bound to one or two peptides and the monomer–dimer shift. Full spectra are available in the supplemental data section. (A) FAT (red), FAT + LD2 1:1 (blue), and FAT + LD4 1:1 (orange); (B) FAT (red), FAT + LD2 1:10 (green), and FAT + LD4 1:1 (orange); (C) FAT + LD2 + LD4 1:1:1 (red), FAT + LD2 + LD4 1:10:1 (blue), and FAT + LD2 1:10 (green); (D) FAT (red), FAT–LD2 (purple), and FAT + LD2 1:1 (green); (E) FAT + LD2 + LD4 1:1:1 (red) and FAT–LD2 + LD4 1:1 (blue); (F) FAT–LD2 + LD4 1:1 (blue) and 15N FAT in a complex with unlabeled paxillin residues 128–308 (green).
Figure 4.
Figure 4.
CD spectra of LD4 helix formation. (A) CD spectra showing the molar ellipticity of samples of 20 μM LD4. As the amount of TFE increased, the percent helicity (inset) of the LD4 peptide increased. (B) Change in total helicity of FAT–LD2 samples (50 μM) containing increasing amounts of LD4 (0.2–2 eq). The predictive model that was used is independent of sample concentration.
Figure 5.
Figure 5.
1H-15N correlation maps of 15N FAT–LD2 bound to spin-labeled LD4 peptides. The peaks in blue represent the assigned signals of 15N FAT–LD2. The overlaid image (red) represents the spectrum after titration with spin-labeled Ser273Cys LD4. Peaks for Asn1000 and Lys1001 have been broadened beyond detection via paramagnetic relaxation. Similar spectra for the spin-labeled Ala263Cys LD4 peptide show the disappearance of signals for residues Arg963, Asn992, and Ala996.
Figure 6.
Figure 6.
A model of the LD4 motif of paxillin in a complex with the FAT domain of FAK. (A) In the docking of LD4 to the FAT domain, it was assumed that the hydrophobic “leucine face” of the peptide is oriented toward FAT. An upper-limit distance constraint of 10 Å between the amide proton of affected residues and the center of paramagnetism was applied. (B) A surface model of the FAT domain. The hydrophobic patch that is between H2 and H3 and serves as the LD-binding site is in brown, and the LD4 peptide is in red. (C) When LD4 is modeled as an α-helix, the three hydrophobic leucine residues line up on one side of the helix creating a potential binding surface. The two spin-label modifications of Ala263Cys LD4 (A) and Ser273Cys LD4 (B) were estimated by using a lysine residue in which the N atom is the same number of bond lengths away as the unpaired electron on the MTSSL-modified cysteine. Spin-labeled Ser273Cys sticks out to the right of the helix; this position explains the loss of signal only for residues in H3 of FAT.
Figure 7.
Figure 7.
A model of paxillin binding to the FAT domain of FAK. The FAT domain is an elongated four-helix bundle with a right-hand twist (A). The LD2 and LD4 motifs of paxillin bind to opposite faces of the four-helix bundle of FAT but are oriented in the same direction (B). The intermediate residues of paxillin remain unstructured in the complex and probably wrap around the H3–H4 side of FAT, although no further binding interactions are observed.

Similar articles

Cited by

References

    1. Arold, S.T., Hoellerer, M.K., and Noble, M.E. 2002. The structural basis of localization and signaling by the focal adhesion targeting domain. Structure 10 319–327. - PubMed
    1. Bellis, S.L., Perrotta, J.A., Curtis, M.S., and Turner, C.E. 1997. Adhesion of fibroblasts to fibronectin stimulates both serine and tyrosine phosphorylation of paxillin. Biochem. J. 325 375–381. - PMC - PubMed
    1. Bertini, I., Donaire, A., Luchinat, C., and Rosato, A. 1997. Paramagnetic relaxation as a tool for solution structure determination: Clostridium pasteurianum ferredoxin as an example. Proteins 29 348–358. - PubMed
    1. Brown, M.C., Perrotta, J.A., and Turner, C.E. 1996. Identification of LIM3 as the principal determinant of paxillin focal adhesion localization and characterization of a novel motif on paxillin directing vinculin and focal adhesion kinase binding. J. Cell Biol. 135 1109–1123. - PMC - PubMed
    1. Brown, M.C., Curtis, M.S., and Turner, C.E. 1998. Paxillin LD motifs may define a new family of protein recognition domains. Nat. Struct. Biol. 5 677–678. - PubMed

Publication types

MeSH terms