. 2005 Feb;115(2):348-58.
doi: 10.1172/JCI22873.

HIV-1 clade promoters strongly influence spatial and temporal dynamics of viral replication in vivo

Affiliations

HIV-1 clade promoters strongly influence spatial and temporal dynamics of viral replication in vivo

Mireille Centlivre et al. J Clin Invest. 2005 Feb.

Abstract

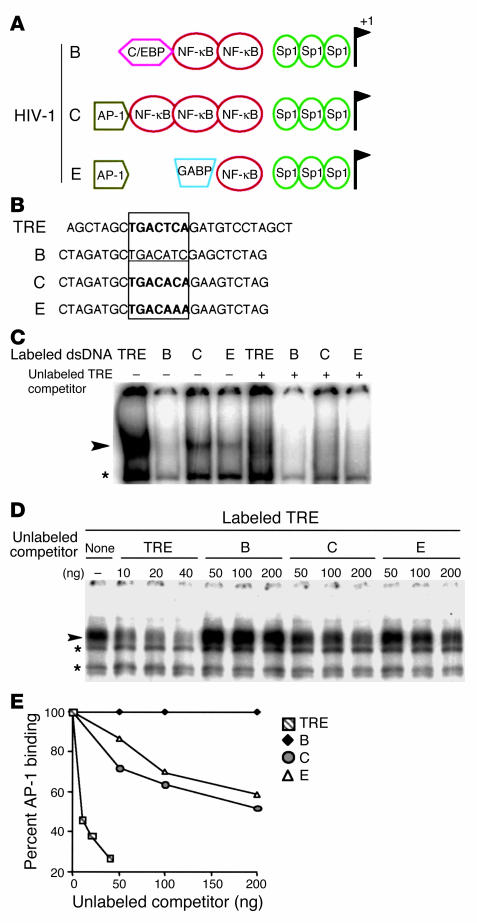
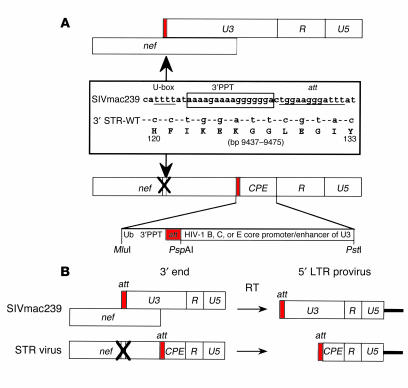
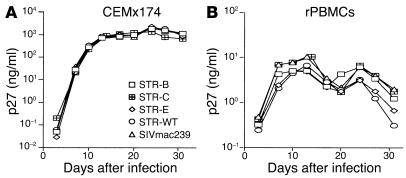
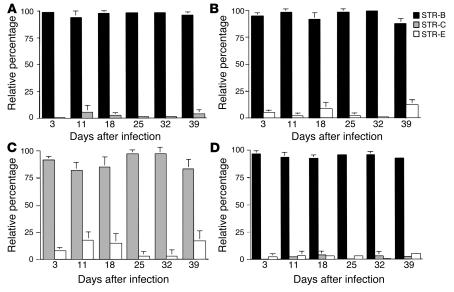
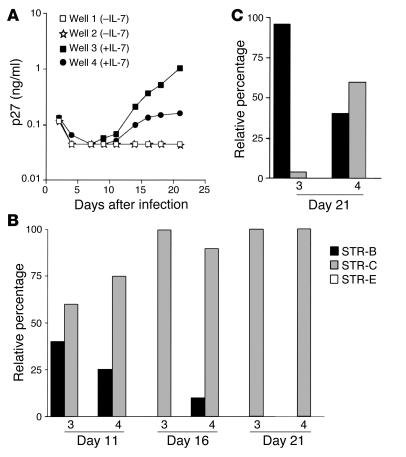
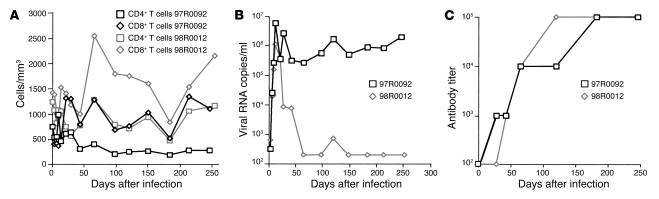
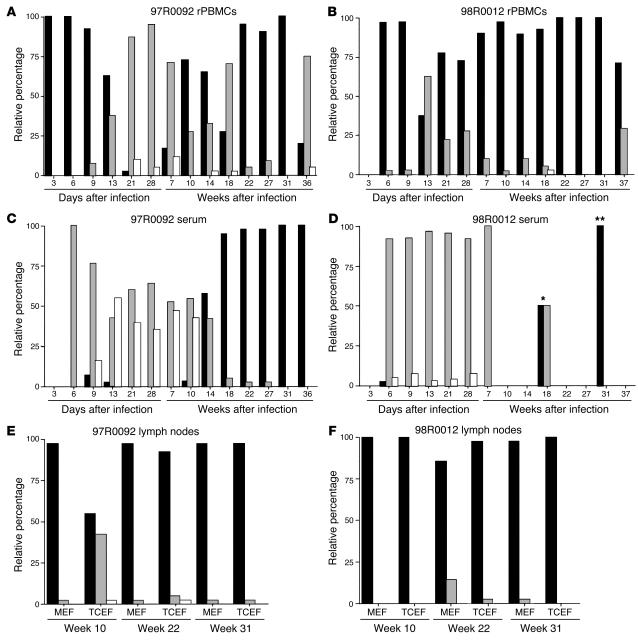
Although the primary determinant of cell tropism is the interaction of viral envelope or capsid proteins with cellular receptors, other viral elements can strongly modulate viral replication. While the HIV-1 promoter is polymorphic for a variety of transcription factor binding sites, the impact of these polymorphisms on viral replication in vivo is not known. To address this issue, we engineered isogenic SIVmac239 chimeras harboring the core promoter/enhancer from HIV-1 clades B, C, and E. Here it is shown that the clade C and E core promoters/enhancers bear a noncanonical activator protein-1 (AP-1) binding site, absent from the corresponding clade B region. Relative ex vivo replication of chimeras was strongly dependent on the tissue culture system used. Notably, in thymic histocultures, replication of the clade C chimera was favored by IL-7 enrichment, which suggests that the clade C polymorphism in the AP-1 and NF-kappaB binding sites is involved. Simultaneous infection of rhesus macaques with the 3 chimeras revealed a strong predominance of the clade C chimera during primary infection. Thereafter, the B chimera dominated in all tissues. These data show that the clade C promoter is particularly adapted to sustain viral replication in primary viremia and that clade-specific promoter polymorphisms constitute a major determinant for viral replication.


Figures

Figure 1
Figure 1
Analysis of putative AP-1 binding sites in HIV-1 clade C and E promoters/enhancers. (A) Polymorphisms among transcription factor binding sites in the core promoter/enhancer regions of HIV-1 clades B, C, and E. The putative clade C and E noncanonical AP-1 binding sites have never before been analyzed experimentally. (B) 5′–3′ strands of the TRE, B, C, and E dsDNA used in gel-shift and competition analyses. The TRE of human collagenase 1, bearing a canonical AP-1 binding site (in bold), was used as positive control. C and E nucleotide sequences span the putative AP-1 binding sites (in bold) of the HIV-1 clade C and E enhancers, respectively. The clade B sequence spans the homologous sequence (underlined) in the enhancer region of the HIV-1 clade B LTR, used as negative control. TRE is flanked by AluI, and viral sequences, by XbaI (B, C, and E) restriction sites. (C) Gel-shift assays with HeLa nuclear extracts. Arrowhead and asterisk indicate AP-1–specific and nonspecific binding, respectively, to the indicated labeled dsDNA (0.5 ng), described in B. The presence of an 80-fold excess of unlabeled dsDNA TRE competitor (+) is indicated. (D and E) Gel-shift competition assays with HeLa nuclear extracts. Arrowhead and asterisks indicate AP-1–specific and nonspecific binding, respectively, to the labeled TRE (0.5 ng). Competition with increasing concentrations of the indicated unlabeled dsDNA competitors is shown on a gel (D) and was quantified by ImageQuant and plotted (E).
Figure 2
Figure 2
Schematic representation of the STR construct. (A) Silent point mutations in nef, cloning sites, and redesigned region of U3 in the 3′LTR are detailed. Dashes in the 3′STR-WT sequence correspond to the same nucleotides as those of the parental SIVmac239 sequence. Both sequences are localized in their respective genomes at positions indicated by arrows. (B) 3′ and 5′ LTR structures in SIVmac239 versus homologous regions in the STR chimeras. CPE, core promoter/enhancer.
Figure 3
Figure 3
Mean values of replication kinetics assays performed in triplicate. Kinetics assays performed on CEMx174 cells (A) and on rPBMCs obtained from 5 SIV-naive Chinese RhMs, pooled just before infection (B).
Figure 4
Figure 4
Growth competition experiments using pooled rPBMCs (each data point is in triplicate). Ex vivo coinfection with STR-B (black bars) and STR-C (gray bars) (A), STR-B and STR-E (white bars) (B), STR-C and STR-E (C), and STR-B, STR-C, and STR-E (D).
Figure 5
Figure 5
Growth competition experiments using fresh human thymus fragments. (A) Global viral kinetics were performed in duplicate in the absence (wells 1 and 2) or presence (wells 3 and 4) of 5 ng/ml IL-7. (B and C) Relative percentage of STR chimeras determined for thymic histoculture supernatants (B) and cells (C) from wells 3 and 4.
Figure 6
Figure 6
Immunological and virological parameters after infection of RhMs 97R0092 and 98R0012. (A) Blood CD4+ and CD8+ T lymphocyte counts. (B) Serum viral RNA loads (lower limit of detection, 200 copies/ml). (C) Serum antibody responses to infection by STR chimeras (lower limit of detection, 100-fold dilution). In C, y axis values represent the reciprocal of experimental values.
Figure 7
Figure 7
Relative frequency of STR chimeras. Relative frequencies were determined in rPBMCs of monkey 97R0092 (A) and monkey 98R0012 (B); in serum of monkey 97R0092 (C) and monkey 98R0012 (D) (* and ** correspond to a viremia of 740 copies/ml and to a value just at the cut-off, respectively); and in MEFs and TCEFs obtained from the lymph nodes of monkey 97R0092 (E) and monkey 98R0012 (F).
Figure 8
Figure 8
Immunohistochemical analysis of LCs in skin and vagina. Representative data from monkey 98R0012 are given. (AF) HLA-DR expression in skin (A) and vagina (D); CD1a expression in skin (B) and vagina (E); and CD3 expression in skin (C) and vagina (F). Magnification, ×400 (AC) and ×200 (DF). (G and H) Representative histograms of CD1a+ cells (gray peaks) and CD1a cells (purple peaks) from LC-enriched fractions in skin (G) and vagina (H).

Similar articles

Cited by

References

    1. McIlroy D, et al. Infection frequency of dendritic cells and CD4+ T lymphocytes in spleens of human immunodeficiency virus-positive patients. J. Virol. 1995;69:4737–4745. - PMC - PubMed
    1. Collman RG, Perno CF, Crowe SM, Stevenson M, Montaner LJ. HIV and cells of macrophage/dendritic lineage and other non-T cell reservoirs: new answers yield new questions. J. Leukoc. Biol. 2003;74:631–634. - PubMed
    1. Pierson TC, Doms RW. HIV-1 entry and its inhibition. Curr. Top. Microbiol. Immunol. 2003;281:1–27. - PubMed
    1. Fulcher JA, et al. Compartmentalization of human immunodeficiency virus type 1 between blood monocytes and CD4+ T cells during infection. J. Virol. 2004;78:7883–7893. - PMC - PubMed
    1. Roof P, et al. Differential regulation of HIV-1 clade-specific B, C, and E long terminal repeats by NF-kappaB and the Tat transactivator. Virology. 2002;296:77–83. - PubMed

Publication types

MeSH terms