Comparative Study
. 2005 Feb 3:6:9.
doi: 10.1186/1471-2202-6-9.

Nucleus accumbens core lesions retard instrumental learning and performance with delayed reinforcement in the rat

Affiliations
Comparative Study

Nucleus accumbens core lesions retard instrumental learning and performance with delayed reinforcement in the rat

Rudolf N Cardinal et al. BMC Neurosci. .

Abstract

Background: Delays between actions and their outcomes severely hinder reinforcement learning systems, but little is known of the neural mechanism by which animals overcome this problem and bridge such delays. The nucleus accumbens core (AcbC), part of the ventral striatum, is required for normal preference for a large, delayed reward over a small, immediate reward (self-controlled choice) in rats, but the reason for this is unclear. We investigated the role of the AcbC in learning a free-operant instrumental response using delayed reinforcement, performance of a previously-learned response for delayed reinforcement, and assessment of the relative magnitudes of two different rewards.

Results: Groups of rats with excitotoxic or sham lesions of the AcbC acquired an instrumental response with different delays (0, 10, or 20 s) between the lever-press response and reinforcer delivery. A second (inactive) lever was also present, but responding on it was never reinforced. As expected, the delays retarded learning in normal rats. AcbC lesions did not hinder learning in the absence of delays, but AcbC-lesioned rats were impaired in learning when there was a delay, relative to sham-operated controls. All groups eventually acquired the response and discriminated the active lever from the inactive lever to some degree. Rats were subsequently trained to discriminate reinforcers of different magnitudes. AcbC-lesioned rats were more sensitive to differences in reinforcer magnitude than sham-operated controls, suggesting that the deficit in self-controlled choice previously observed in such rats was a consequence of reduced preference for delayed rewards relative to immediate rewards, not of reduced preference for large rewards relative to small rewards. AcbC lesions also impaired the performance of a previously-learned instrumental response in a delay-dependent fashion.

Conclusions: These results demonstrate that the AcbC contributes to instrumental learning and performance by bridging delays between subjects' actions and the ensuing outcomes that reinforce behaviour.


Figures

Figure 1
Figure 1
Task schematic: free-operant instrumental responding on a fixed-ratio-1 (FR-1) schedule with delayed reinforcement Subjects are offered two levers; one (the active lever) delivers a single food pellet for every press (an FR-1 schedule) and the other (the inactive lever) has no programmed consequence. Food can either be delivered immediately (a) or after a delay (b) following responses on the active lever. The levers remain available throughout the session (hence, free-operant responding: animals are free to perform the operant at any time). Events of interest are lever presses, delivery of food pellets, and collection of food by the rat (when it pokes its nose into the food alcove following food delivery). To obtain food, the hungry rat must discriminate the active from the inactive lever, which is more difficult when the outcome is delayed. In these examples, the rat's response patterns (active and inactive lever presses, and collection of food) are fictional, while food delivery is contingent upon active lever pressing.
Figure 2
Figure 2
Schematic of lesions of the AcbC Black shading indicates the extent of neuronal loss common to all subjects; grey indicates the area lesioned in at least one subject. Coronal sections are (from top to bottom) +2.7, +2.2, +1.7, +1.2, and +0.7 mm relative to bregma. Diagrams are modified from reference [83]. Panels a-c correspond to Experiment 1, in which lesions were made before training; panels d-f correspond to Experiment 2, in which lesions were made after initial training. Panels a & d show groups trained with no delays; panels b & e show groups trained with 10 s delays; panels c & f show groups trained with 20 s delays.
Figure 3
Figure 3
Photomicrographs of lesions of the AcbC Lesions of the AcbC: photomicrographs of sections ~1.2 mm anterior to bregma, stained with cresyl violet. (a) Sham-operated rat, low-magnification view, right hemisphere (medial to the left). LV, lateral ventricle; CPu, caudate/putamen; AcbSh, nucleus accumbens shell; AcbC, nucleus accumbens core; ac, anterior commissure. The box marks the area magnified in (b). (b) Sham-operated rat, high-magnification view. Cresyl violet is basic and stains for Nissl substance, primarily nucleic acids (DNA and RNA); it therefore stains cytoplasmic rough endoplasmic reticulum, nuclei, and nucleoli. Individual neuronal nuclei are visible (circles ~10 μm in diameter). (c) AcbC-lesioned rat, low-magnification view. Dotted lines show the approximate extent of the lesion. There is some tissue collapse within the lesion and the lateral ventricle is slightly expanded. The box marks the area magnified in (d). (d) AcbC-lesioned rat, high-magnification view. In the region of the lesion, neurons have been replaced by smaller, densely-staining cells, indicating gliosis. (e) Coronal diagram of the rat brain at the same anteroposterior level [83], with scale. The light grey box indicates approximately the region shown in (a) and (c); the dark grey box indicates approximately the region shown in (b) and (e).
Figure 4
Figure 4
Effects of delays to reinforcement on acquisition of free-operant responding under an FR-1 schedule Data plotted to show the effects of delays. All groups discriminated between the active and the inactive lever, and delays retarded acquisition of the active lever response in both groups. (a) Responding of sham-operated control rats, under all three response-reinforcer delay conditions. (b) Responding of AcbC-lesioned rats under all delay conditions. The next figure replots these data to show the effect of the lesion more clearly.
Figure 5
Figure 5
Effect of AcbC lesions on acquisition of free-operant responding with delayed reinforcement Data plotted to show the effects of AcbC lesions (same data as in the previous figure). There was a delay-dependent impairment in AcbC-lesioned rats, who learned less well than shams only when reinforcement was delayed. (a) With a delay of 0 s, AcbC-lesioned rats learned just as well as shams; in fact, they responded more on the active lever than shams did. (b) With a 10 s delay, AcbC-lesioned rats were impaired at learning compared to shams. (c) With a 20 s delay, the impairment in AcbC-lesioned rats was larger still.
Figure 6
Figure 6
Programmed and experienced delays to reinforcement AcbC-lesioned rats experienced slightly longer response-delivery delays (the delay between the most recent active lever press and pellet delivery) than shams in the 20 s condition, and slightly longer response-collection delays (the delay between the most recent active lever press and pellet collection) in the 10 s and 20 s conditions. (a) Mean experienced response-delivery delays (one value calculated per subject). When the programmed delay was 0 s, reinforcers were delivered immediately so no data are shown. There was a lesion × programmed delay interaction (F1,26 = 12.0, p = .002): when the programmed delay was 10 s, the experienced delays did not differ between groups (F < 1, NS), but when the programmed delay was 20 s, AcbC-lesioned rats experienced longer response-delivery delays (one-way ANOVA, F1,13 = 19.0, ** p = .001). (b) Mean experienced response-collection delays (one value calculated per subject). There was a lesion × programmed delay interaction (F2,38 = 7.14, p = .002): AcbC-lesioned rats did not experience significantly different delays when the programmed delay was 0 s (F < 1, NS) or 10 s (F1,13 = 4.52, p = .053), but experienced significantly longer response-collection delays when the programmed delay was 20 s (F1,13 = 15.4, ** p = .002). (c) Distribution of experienced response-delivery delays. All experienced delays for a given subject were aggregated across all sessions, and the proportion falling into different 2 s ranges were calculated to give one value per range per subject; the graphs show means ± SEMs of these values. The interval notation '[a, b)' indicates that a given delay x falls in the range a x <b. There were no differences in the distribution of delays experienced by AcbC-lesioned and sham rats in the 10 s condition (lesion and lesion × range, Fs < 1, NS), but in the 20 s condition AcbC-lesioned rats experienced slightly fewer short delays and slightly more long delays (lesion × range, F2.1,27.7 = 6.60, formula image 
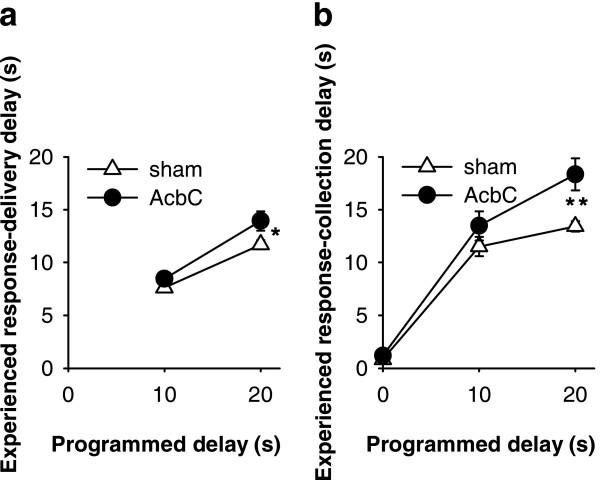
= .213, p = .004). (d) Distribution of experienced response-collection delays, displayed in the same manner as (c). There were no differences in the distribution of delays experienced by AcbC-lesioned and sham rats in the 0 s condition (lesion and lesion × range, Fs < 1, NS). In the 10 s condition, AcbC-lesioned rats experienced a slightly higher proportion of long response-collection delays and a slightly lower proportion of short response-collection delays (lesion, F1,13 = 6.36, p = .036, though the lesion × range interaction was not significant, F2.6,34.3 = 1.74, formula image = .139, p = .181). Similarly, in the 20 s condition, AcbC-lesioned rats experienced a slightly higher proportion of long response-collection delays and a slightly lower proportion of short response-collection delays than shams (lesion × range, F4.2,54.8 = 6.65, formula image = .222, p < .001).
Figure 7
Figure 7
Learning as a function of programmed and experienced delays to reinforcement The imposition of response-reinforcer delays systematically retarded the acquisition of free-operant instrumental responding, and this relationship was altered in AcbC-lesioned rats, even allowing for differences in experienced response-collection delays. (a) The rate of responding on the active lever in session 10 is plotted against the programmed response-reinforcer delay. AcbC-lesioned rats responded more than shams at zero delay (* p = .013), but less than shams at 10 s (* p = .049) and 20 s delay (*** p = .001). (b) Responding on the active lever in session 10 plotted against the experienced response-to-reinforcer collection delays for sessions 1–10 (vertical error bars: SEM of the square-root-transformed number of responses in session 10; horizontal error bars: SEM of the experienced response-collection delay, calculated up to and including that session). The gradients of the two lines differed significantly (### p = .001; see text), indicating that the relationship between experienced delays and responding was altered in AcbC-lesioned rats.
Figure 8
Figure 8
Discrimination of reinforcer magnitude: matching of relative response rate to relative reinforcement rate AcbC-lesioned rats exhibited better sensitivity to the difference between 1 and 4 food pellets than shams did. Subjects responded on two concurrent RI-60-s schedules, designated A and B, and the reinforcer magnitude for each schedule was varied. Data from the last session of each condition are plotted (sessions 11, 19, and 27; see Table 1); programmed reinforcement ratios were 0.2 (1 food pellet on schedule A and 4 pellets on schedule B), 0.5 (1:1 pellets), and 0.8 (4:1 pellets). The abscissa (horizontal axis) shows experienced reinforcement ratios (mean ± SEM); the ordinate (vertical axis) shows response allocation (mean ± SEM). Both groups exhibited substantial undermatching (deviation away from the predictions of the matching law and towards indifference). However, neither group was indifferent to the reinforcement ratio: the sham and AcbC groups both adjusted their response allocation towards the lever delivering the reinforcer with the greater magnitude (*** p < .001). Matching was better in AcbC-lesioned rats than in shams (lines of different gradient, # p = .021), suggesting that they were more sensitive to the difference between 1 and 4 food pellets.
Figure 9
Figure 9
Postoperative performance under an FR-1 schedule for delayed reinforcement Data plotted to show the effects of delays. All groups discriminated between the active and the inactive lever, and delays retarded acquisition of the active lever response in both groups. Postoperatively, shams' performance was unaltered, as was that of AcbC-lesioned rats in the 0 s delay condition. However, active lever responding was impaired postoperatively in AcbC-lesioned rats in the 10 s and 20 s conditions. (a) Responding of sham-operated control rats, under all three response-reinforcer delay conditions. The vertical black line indicates the time of surgery, between testing sessions 14 and 15. (b) Responding of AcbC-lesioned rats under all delay conditions. The next figure replots these data to show the effect of the lesion more clearly.
Figure 10
Figure 10
Effect of AcbC lesions on performance of free-operant responding for delayed reinforcement Data plotted to show the effects of AcbC lesions (same data as in the previous figure). There was a delay-dependent impairment in AcbC-lesioned rats, who were impaired by the lesion only when reinforcement was delayed. (a) With a delay of 0 s, AcbC-lesioned rats performed just as well as shams postoperatively. The vertical black line indicates the time of surgery, between testing sessions 14 and 15. (b) With a 10 s delay, AcbC-lesioned rats were impaired postoperatively compared to shams. (c) With a 20 s delay, the postoperative impairment in AcbC-lesioned rats was larger still, to the extent that their discrimination between active and inactive levers was no longer significant.
Figure 11
Figure 11
Programmed and experienced delays to reinforcement following AcbC lesions made after initial training AcbC-lesioned rats experienced slightly longer response-delivery and response-collection delays than shams in the 20 s condition. Lesions were made after initial training; postoperative experienced delays are plotted. (Compare Figure 6, in which rats had no preoperative experience of the task.) (a) Mean experienced response-delivery delays (one value calculated per subject). When the programmed delay was 0 s, reinforcers were delivered immediately so no data are shown. There were main effects of lesion (F1,21 = 9.14) and delay (F1,21 = 87.5, p < .001) but no lesion × delay interaction (F1,21 = 1.91, NS). When the programmed delay was 10 s, the experienced delays did not quite differ significantly between groups (F1,10 = 4.61, p = .057), but when the programmed delay was 20 s, AcbC-lesioned rats experienced longer response-delivery delays (F1,11 = 6.29, * p = .029). (b) Mean experienced response-collection delays (one value calculated per subject). There was a lesion × delay interaction (F2,31 = 3.85, p = .032), as well as main effects of lesion (F1,31 = 11.9, p = .002) and delay (F2,31 = 171, p < .001). AcbC-lesioned rats did not experience significantly different delays when the programmed delay was 0 s (F1,10 = 1.74, NS) or 10 s (F1,10 = 1.49, NS), but experienced significantly longer response-collection delays when the programmed delay was 20 s (F1,11 = 13.7, ** p = .003).
Figure 12
Figure 12
Performance as a function of delays to reinforcement in animals trained preoperatively Response-reinforcer delays systematically lowered the rate of free-operant instrumental responding, and this relationship was altered in AcbC-lesioned rats, even allowing for differences in response-collection delays experienced postoperatively. Lesions were made after initial training; postoperative experienced delays and response rates are plotted. (Compare Figure 7, in which rats had no preoperative experience of the task.) (a) The rate of responding on the active lever in session 24 (the 10th postoperative session; compare Figure 7) is plotted against the programmed response-reinforcer delay. AcbC-lesioned rats responded significantly less than shams in the 20 s delay condition (* p = .025). (b) Responding on the active lever in session 24 (the 10th postoperative session) plotted against the experienced response-to-reinforcer-collection delays for postoperative sessions up to and including session 24 (vertical error bars: SEM of the square-root-transformed number of responses in session 24; horizontal error bars: SEM of the experienced response-collection delay). The gradients of the two lines differed significantly (# p = .015; see text), indicating that the relationship between experienced delays and responding was altered in AcbC-lesioned rats, compared to sham-operated controls.
Figure 13
Figure 13
Locomotor activity in a novel environment and body mass AcbC-lesioned rats were significantly hyperactive compared to sham-operated controls, and gained less weight, in both Experiments 1 & 2. (a) Locomotor activity in Experiment 1. Analysis using the model lesion2 × (bin12 × S) revealed effects of lesion (F1,42 = 5.12, * p = .029), reflecting hyperactivity in the AcbC group, with additional effects of bin (F5.7,237.9 = 13.3, formula image 
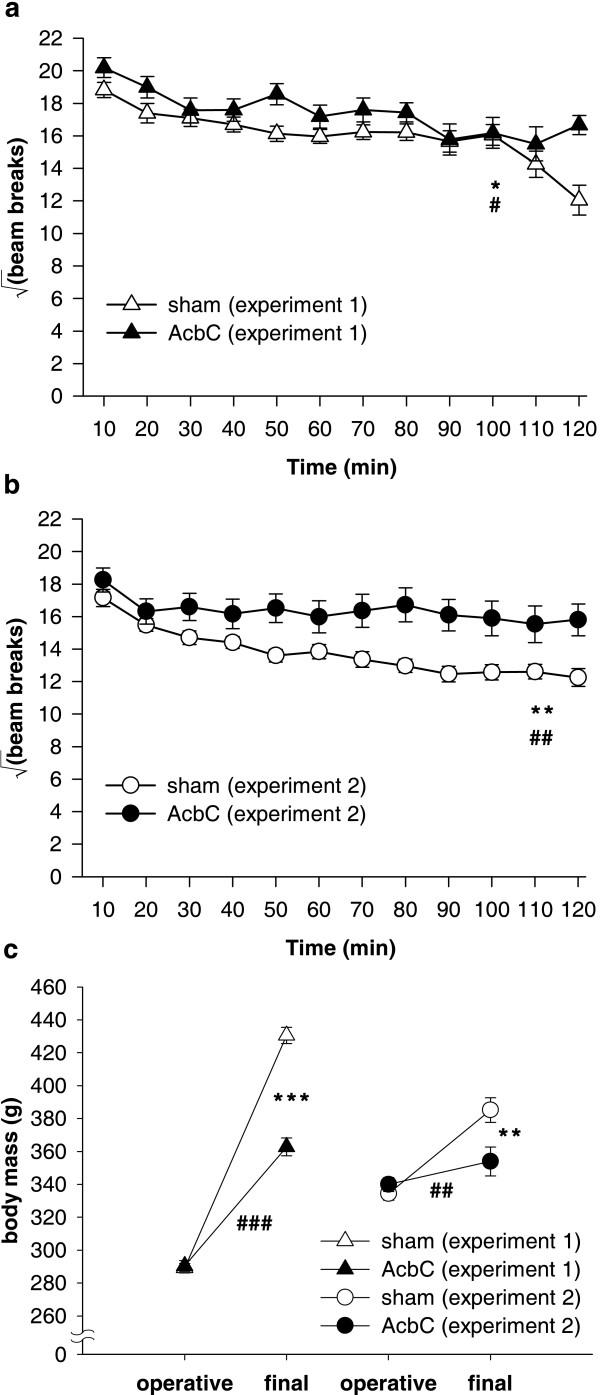
= .515, p < .001), reflecting habituation, and a lesion × bin interaction (F5.7,237.9 = 2.52, formula image = .515, # p = .024). (b) Locomotor activity in Experiment 2. The same patterns were observed (data from five subjects were not recorded due to a mechanical error; lesion: F1,37 = 9.155, ** p = .004; bin: F9.3,345.2 = 13.5, formula image = .848, p < .001; lesion × bin: F9.3,345.2 = 3.18, formula image = .848, ## p = .001). (c) Preoperative and final body mass in both experiments. Preoperatively, masses did not differ between groups (Experiment 1: F < 1, NS; Experiment 2: F1,42 = 1.008, NS), but in both cases, AcbC-lesioned subjects gained less mass than controls (Experiment 1: lesion × time: F1,41 = 95.9, ### p < .001; group difference at second time point: F1,42 = 88.4, *** p < .001; Experiment 2: lesion × time: F1,42 = 13.53, ## p = .001; group difference at second time point: F1,42 = 7.37, ** p = .01).

Similar articles

Cited by

References

    1. Dickinson A, Watt A, Griffiths WJH. Free-operant acquisition with delayed reinforcement. Quarterly Journal of Experimental Psychology, Section B - Comparative and Physiological Psychology. 1992;45:241–258.
    1. Rahman S, Sahakian BJ, Cardinal RN, Rogers RD, Robbins TW. Decision making and neuropsychiatry. Trends in Cognitive Sciences. 2001;5:271–277. doi: 10.1016/S1364-6613(00)01650-8. - DOI - PubMed
    1. APA . Diagnostic and Statistical Manual of Mental Disorders, fourth edition, text revision (DSM-IV-TR) Washington DC, American Psychiatric Association; 2000.
    1. Evenden JL. Varieties of impulsivity. Psychopharmacology. 1999;146:348–361. - PubMed
    1. Ainslie G. Specious reward: a behavioral theory of impulsiveness and impulse control. Psychological Bulletin. 1975;82:463–496. - PubMed

Publication types