Ultrahigh-resolution optical coherence tomography in glaucoma
- PMID: 15691556
- PMCID: PMC1936975
- DOI: 10.1016/j.ophtha.2004.08.021
Ultrahigh-resolution optical coherence tomography in glaucoma
Abstract
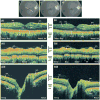
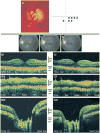
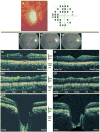
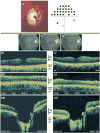
Objective: Optical coherence tomography (OCT) has been shown to be a valuable tool in glaucoma assessment. We investigated a new ultrahigh-resolution OCT (UHR-OCT) imaging system in glaucoma patients and compared the findings with those obtained by conventional-resolution OCT.
Design: Retrospective comparative case series.
Participants: A normal subject and 4 glaucoma patients representing various stages of glaucomatous damage.
Testing: All participants were scanned with StratusOCT (axial resolution of approximately 10 mum) and UHR-OCT (axial resolution of approximately 3 microm) at the same visit.
Main outcome measure: Comparison of OCT findings detected with StratusOCT and UHR-OCT.
Results: Ultrahigh-resolution OCT provides a detailed cross-sectional view of the scanned retinal area that allows differentiation between retinal layers. These UHR images were markedly better than those obtained by the conventional-resolution OCT.
Conclusions: Ultrahigh-resolution OCT provides high-resolution images of the ocular posterior segment, which improves the ability to detect retinal abnormalities due to glaucoma.
Figures


Similar articles
-
Improved visualization of glaucomatous retinal damage using high-speed ultrahigh-resolution optical coherence tomography.Ophthalmology. 2008 May;115(5):782-789.e2. doi: 10.1016/j.ophtha.2007.06.038. Epub 2007 Sep 20. Ophthalmology. 2008. PMID: 17884170 Free PMC article.
-
Optic disk and nerve fiber layer imaging to detect glaucoma.Am J Ophthalmol. 2007 Nov;144(5):724-32. doi: 10.1016/j.ajo.2007.07.010. Epub 2007 Sep 14. Am J Ophthalmol. 2007. PMID: 17868631 Free PMC article.
-
Diagnostic capability of optical coherence tomography in evaluating the degree of glaucomatous retinal nerve fiber damage.Invest Ophthalmol Vis Sci. 2006 May;47(5):2006-10. doi: 10.1167/iovs.05-1102. Invest Ophthalmol Vis Sci. 2006. PMID: 16639009
-
OCT for glaucoma diagnosis, screening and detection of glaucoma progression.Br J Ophthalmol. 2014 Jul;98 Suppl 2(Suppl 2):ii15-9. doi: 10.1136/bjophthalmol-2013-304326. Epub 2013 Dec 19. Br J Ophthalmol. 2014. PMID: 24357497 Free PMC article. Review.
-
Detecting Structural Progression in Glaucoma with Optical Coherence Tomography.Ophthalmology. 2017 Dec;124(12S):S57-S65. doi: 10.1016/j.ophtha.2017.07.015. Ophthalmology. 2017. PMID: 29157363 Free PMC article. Review.
Cited by
-
Noninvasive volumetric imaging and morphometry of the rodent retina with high-speed, ultrahigh-resolution optical coherence tomography.Invest Ophthalmol Vis Sci. 2006 Dec;47(12):5522-8. doi: 10.1167/iovs.06-0195. Invest Ophthalmol Vis Sci. 2006. PMID: 17122144 Free PMC article.
-
Diagnostic tools for glaucoma detection and management.Surv Ophthalmol. 2008 Nov;53 Suppl1(SUPPL1):S17-32. doi: 10.1016/j.survophthal.2008.08.003. Surv Ophthalmol. 2008. PMID: 19038620 Free PMC article. Review.
-
Imaging of the retinal nerve fibre layer for glaucoma.Br J Ophthalmol. 2009 Feb;93(2):139-43. doi: 10.1136/bjo.2008.145540. Epub 2008 Nov 21. Br J Ophthalmol. 2009. PMID: 19028735 Free PMC article. Review.
-
Optical tecnology developments in biomedicine: history, current and future.Transl Med UniSa. 2011 Oct 17;1:51-150. Print 2011 Sep. Transl Med UniSa. 2011. PMID: 23905030 Free PMC article.
-
Spectral domain optical coherence tomography for glaucoma (an AOS thesis).Trans Am Ophthalmol Soc. 2008;106:426-58. Trans Am Ophthalmol Soc. 2008. PMID: 19277249 Free PMC article.
References
-
- Quigley HA, Addicks EM, Green WR. Optic nerve damage in human glaucoma. III. Quantitative correlation of nerve fiber loss and visual field defect in glaucoma, ischemic neuropathy, papilledema, and toxic neuropathy. Arch Ophthalmol. 1982;100:135–46. - PubMed
-
- Harwerth RS, Carter-Dawson L, Shen F, et al. Ganglion cell losses underlying visual field defects from experimental glaucoma. Invest Ophthalmol Vis Sci. 1999;40:2242–50. - PubMed
-
- Drexler W, Morgner U, Kartner FX, et al. In vivo ultrahigh-resolution optical coherence tomography. Opt Lett. 1999;24:1221–3. - PubMed
Publication types
MeSH terms
Grants and funding
LinkOut - more resources
Full Text Sources
Other Literature Sources
Medical

