Ecotypes of planktonic actinobacteria with identical 16S rRNA genes adapted to thermal niches in temperate, subtropical, and tropical freshwater habitats
- PMID: 15691929
- PMCID: PMC546823
- DOI: 10.1128/AEM.71.2.766-773.2005
Ecotypes of planktonic actinobacteria with identical 16S rRNA genes adapted to thermal niches in temperate, subtropical, and tropical freshwater habitats
Abstract
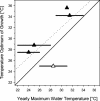
Seven strains with identical 16S rRNA genes affiliated with the Luna2 cluster (Actinobacteria) were isolated from six freshwater habitats located in temperate (Austria and Australia), subtropical (People's Republic of China), and tropical (Uganda) climatic zones. The isolates had sequence differences at zero to five positions in a 2,310-nucleotide fragment of the ribosomal operon, including part of the intergenic spacer upstream of the 16S rRNA gene, the complete 16S rRNA gene, the complete 16S-23S internal transcribed spacer (ITS1), and a short part of the 23S rRNA gene. Most of the few sequence differences found were located in the internal transcribed spacer sequences. Two isolates obtained from habitats in Asia and Europe, as well as two isolates obtained from different habitats in the People's Republic of China, had identical sequences for the entire fragment sequenced. In spite of minimal sequence differences in the part of the ribosomal operon investigated, the strains exhibited significant differences in their temperature response curves (with one exception), as well as pronounced differences in their temperature optima (25.0 to 35.6 degrees C). The observed differences in temperature adaptation were generally in accordance with the thermal conditions in the habitats where the strains were isolated. Strains obtained from temperate zone habitats had the lowest temperature optima, strains from subtropical habitats had intermediate temperature optima, and a strain from a tropical habitat had the highest temperature optimum. Based on the observed temperature responses, we concluded that the strains investigated are well adapted to the thermal conditions in their home habitats. Consequently, these closely related strains represent different ecotypes adapted to different thermal niches.
Figures


Similar articles
-
Diversity of culturable actinobacteria isolated from marine sponge Haliclona sp.Antonie Van Leeuwenhoek. 2007 Nov;92(4):405-16. doi: 10.1007/s10482-007-9169-z. Epub 2007 Jun 14. Antonie Van Leeuwenhoek. 2007. PMID: 17566868
-
Culturable actinobacteria from the marine sponge Hymeniacidon perleve: isolation and phylogenetic diversity by 16S rRNA gene-RFLP analysis.Antonie Van Leeuwenhoek. 2006 Aug;90(2):159-69. doi: 10.1007/s10482-006-9070-1. Epub 2006 Jul 27. Antonie Van Leeuwenhoek. 2006. PMID: 16871424
-
'Candidatus Planktophila limnetica', an actinobacterium representing one of the most numerically important taxa in freshwater bacterioplankton.Int J Syst Evol Microbiol. 2009 Nov;59(Pt 11):2864-9. doi: 10.1099/ijs.0.010199-0. Epub 2009 Jul 23. Int J Syst Evol Microbiol. 2009. PMID: 19628588
-
Diversity and abundance of Gram positive bacteria in a tidal flat ecosystem.Environ Microbiol. 2007 Jul;9(7):1810-22. doi: 10.1111/j.1462-2920.2007.01302.x. Environ Microbiol. 2007. PMID: 17564614
-
Use of complex physiological traits as ecotoxicological biomarkers in tropical freshwater fishes.J Exp Zool A Ecol Integr Physiol. 2021 Nov;335(9-10):745-760. doi: 10.1002/jez.2540. Epub 2021 Sep 16. J Exp Zool A Ecol Integr Physiol. 2021. PMID: 34529366 Review.
Cited by
-
Large variabilities in host strain susceptibility and phage host range govern interactions between lytic marine phages and their Flavobacterium hosts.Appl Environ Microbiol. 2007 Nov;73(21):6730-9. doi: 10.1128/AEM.01399-07. Epub 2007 Aug 31. Appl Environ Microbiol. 2007. PMID: 17766444 Free PMC article.
-
Ecological Succession Pattern of Fungal Community in Soil along a Retreating Glacier.Front Microbiol. 2017 Jun 9;8:1028. doi: 10.3389/fmicb.2017.01028. eCollection 2017. Front Microbiol. 2017. PMID: 28649234 Free PMC article.
-
Biogeographic patterns of bacterial microdiversity in Arctic deep-sea sediments (HAUSGARTEN, Fram Strait).Front Microbiol. 2015 Jan 5;5:660. doi: 10.3389/fmicb.2014.00660. eCollection 2014. Front Microbiol. 2015. PMID: 25601856 Free PMC article.
-
Assessing niche separation among coexisting Limnohabitans strains through interactions with a competitor, viruses, and a bacterivore.Appl Environ Microbiol. 2010 Mar;76(5):1406-16. doi: 10.1128/AEM.02517-09. Epub 2009 Dec 28. Appl Environ Microbiol. 2010. PMID: 20038688 Free PMC article.
-
A guide to the natural history of freshwater lake bacteria.Microbiol Mol Biol Rev. 2011 Mar;75(1):14-49. doi: 10.1128/MMBR.00028-10. Microbiol Mol Biol Rev. 2011. PMID: 21372319 Free PMC article. Review.
References
-
- Asiyo, S. G. 2003. The phytoplankton primary productivity, biomass and species composition in the Finger Ponds Uganda. M.Sc. Thesis, UNESCO-IHE Delft, The Netherlands.
-
- Baas-Becking, L. G. M. 1934. Geobiologie of Inleiding tot de Milieukunde. Van Stockum & Zon, The Hague, The Netherlands.
-
- Boenigk, J., K. Pfandl, P. Stadler, and A. Chatzinotas. Submitted for publication.
-
- Bronikowski, A. M., A. F. Bennett, and R. E. Lenski. 2001. Evolutionary adaptation to temperature. VIII. Effects of temperature on growth rate in natural isolates of Escherichia coli and Salmonella enterica from different thermal environments. Evolution 55:33-40. - PubMed
Publication types
MeSH terms
Substances
Associated data
- Actions
- Actions
- Actions
- Actions
- Actions
- Actions
- Actions
- Actions
LinkOut - more resources
Full Text Sources
Molecular Biology Databases

