

Transcriptional organization of genes for protocatechuate and quinate degradation from Acinetobacter sp. strain ADP1
- PMID: 15691962
- PMCID: PMC546756
- DOI: 10.1128/AEM.71.2.1025-1034.2005
Transcriptional organization of genes for protocatechuate and quinate degradation from Acinetobacter sp. strain ADP1
Abstract
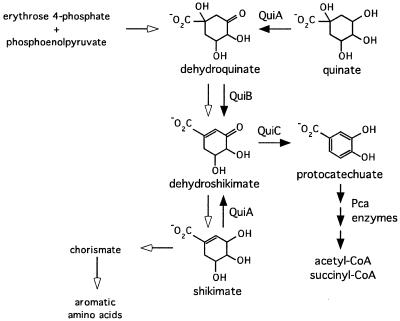
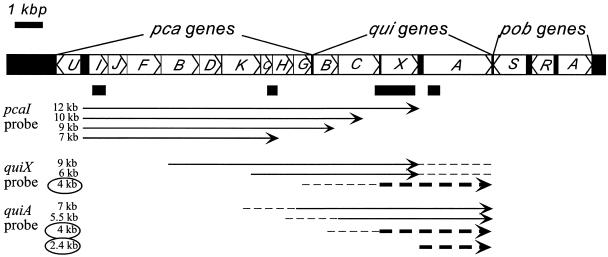
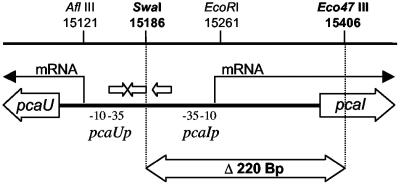
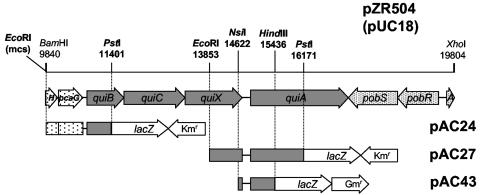
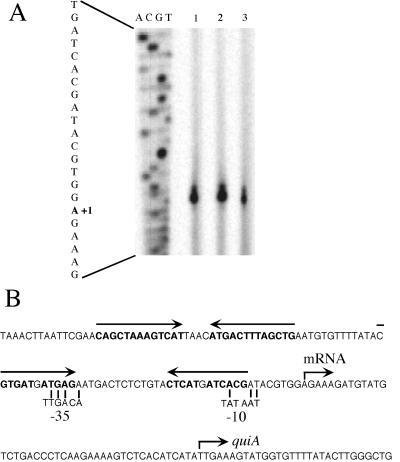
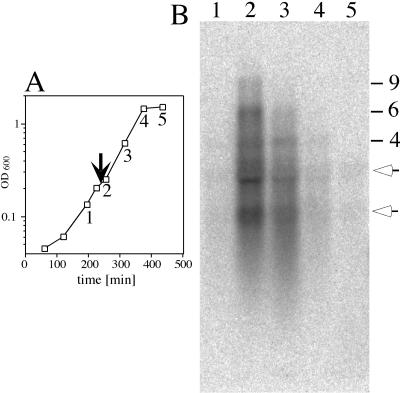
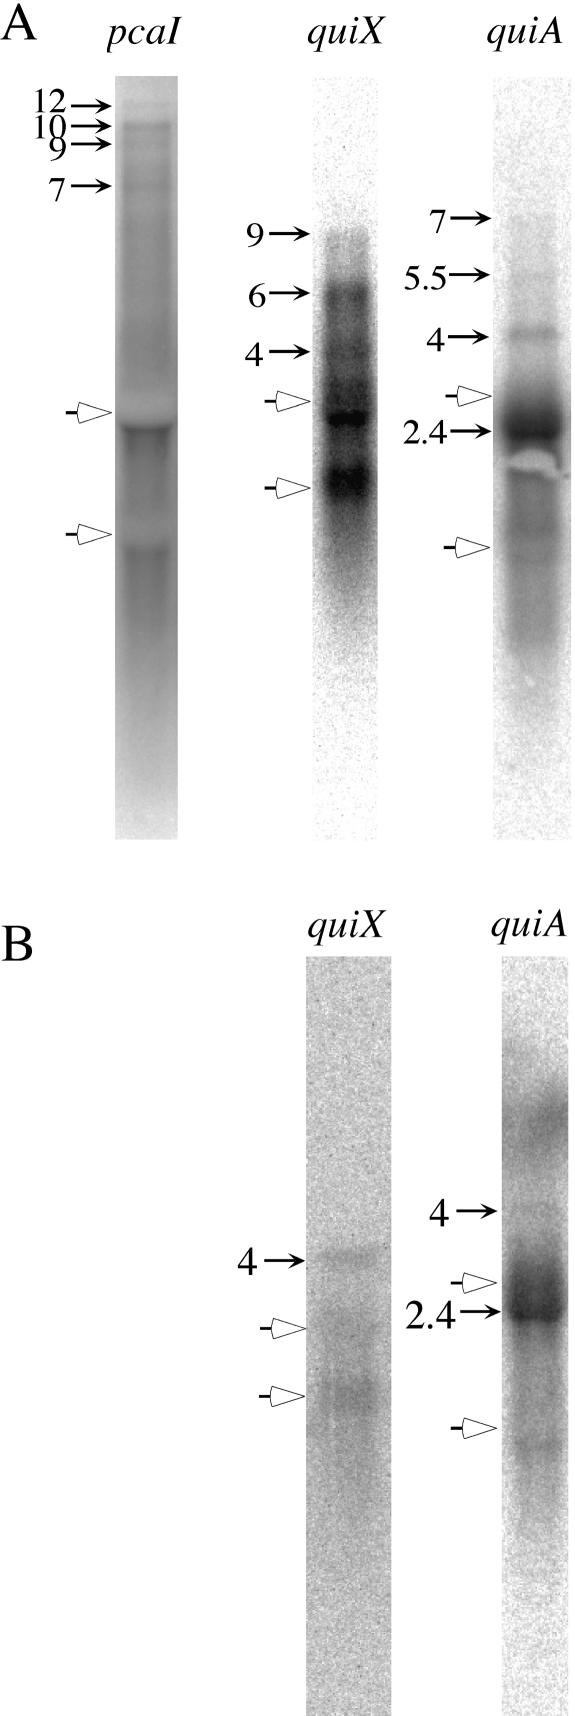
Quinate and protocatechuate are both abundant plant products and can serve, along with a large number of other aromatic or hydroaromatic compounds, as growth substrates for Acinetobacter sp. strain ADP1. The respective genes are part of the chromosomal dca-pca-qui-pob-hca cluster encoding these pathways. The adjacent pca and qui gene clusters, which encode enzymes for protocatechuate breakdown via the beta-ketoadipate pathway and for the conversion of quinate or shikimate to protocatechuate, respectively, have the same direction of transcription and are both expressed inducibly in response to protocatechuate. The pca genes are governed by the transcriptional activator-repressor PcaU. The mechanism governing qui gene expression was previously unknown. Here we report data suggesting the existence of a large 14-kb primary transcript covering the pca and qui genes. The area between the pca and qui genes contains no promoter activity, whereas a weak, constitutive promoter was identified upstream of quiA (quiAp). The 5' end of the quiA transcript was mapped. Northern blot analysis allowed the identification of a 12-kb transcript spanning pcaI to quiX. An analysis of the pca and qui gene transcripts in a strain missing the structural gene promoter pcaIp led to the identification of two pcaIp-independent transcripts (4 and 2.4 kb). The 2.4-kb transcript makes up about 25% of the total transcript abundance of quiA, and thus the majority of transcription of the last gene of the area is also driven by pcaIp. This report strongly supports the organization of the pca and qui genes as a pca-qui operon and, furthermore, suggests that PcaU is the regulator governing its expression.
Figures
Similar articles
-
Multiple-level regulation of genes for protocatechuate degradation in Acinetobacter baylyi includes cross-regulation.Appl Environ Microbiol. 2007 Jan;73(1):232-42. doi: 10.1128/AEM.01608-06. Epub 2006 Nov 3. Appl Environ Microbiol. 2007. PMID: 17085716 Free PMC article.
-
PcaU, a transcriptional activator of genes for protocatechuate utilization in Acinetobacter.J Bacteriol. 1998 Mar;180(6):1512-24. doi: 10.1128/JB.180.6.1512-1524.1998. J Bacteriol. 1998. PMID: 9515921 Free PMC article.
-
Effects exerted by transcriptional regulator PcaU from Acinetobacter sp. strain ADP1.J Bacteriol. 2001 Feb;183(3):873-81. doi: 10.1128/JB.183.3.873-881.2001. J Bacteriol. 2001. PMID: 11208784 Free PMC article.
-
The osmotic stress response operon betIBA is under the functional regulation of BetI and the quorum-sensing regulator AnoR in Acinetobacter nosocomialis.J Microbiol. 2020 Jun;58(6):519-529. doi: 10.1007/s12275-020-0186-1. Epub 2020 May 27. J Microbiol. 2020. PMID: 32462489 Review.
-
Relationships between protein-encoding gene abundance and corresponding process are commonly assumed yet rarely observed.ISME J. 2015 Aug;9(8):1693-9. doi: 10.1038/ismej.2014.252. Epub 2014 Dec 23. ISME J. 2015. PMID: 25535936 Free PMC article. Review.
Cited by
-
Transcriptional organization and regulation of magnetosome operons in Magnetospirillum gryphiswaldense.Appl Environ Microbiol. 2006 Sep;72(9):5757-65. doi: 10.1128/AEM.00201-06. Appl Environ Microbiol. 2006. PMID: 16957191 Free PMC article.
-
Role of Acinetobacter baylyi Crc in catabolite repression of enzymes for aromatic compound catabolism.J Bacteriol. 2009 Apr;191(8):2834-42. doi: 10.1128/JB.00817-08. Epub 2009 Feb 6. J Bacteriol. 2009. PMID: 19201803 Free PMC article.
-
Novel metabolic features in Acinetobacter baylyi ADP1 revealed by a multiomics approach.Metabolomics. 2014;10(6):1223-1238. doi: 10.1007/s11306-014-0662-x. Epub 2014 Apr 29. Metabolomics. 2014. PMID: 25374488 Free PMC article.
-
Regulation of expression of genes involved in quinate and shikimate utilization in Corynebacterium glutamicum.Appl Environ Microbiol. 2009 Jun;75(11):3461-8. doi: 10.1128/AEM.00163-09. Epub 2009 Apr 17. Appl Environ Microbiol. 2009. PMID: 19376919 Free PMC article.
-
Mechanistic Modeling of Biochemical Systems without A Priori Parameter Values Using the Design Space Toolbox v.3.0.iScience. 2020 Jun 26;23(6):101200. doi: 10.1016/j.isci.2020.101200. Epub 2020 May 23. iScience. 2020. PMID: 32531747 Free PMC article.
References
-
- Adachi, O., N. Yoshihara, S. Tanasupawat, H. Toyama, and K. Matsushita. 2003. Purification and characterization of membrane-bound quinoprotein quinate dehydrogenase. Biosci. Biotechnol. Biochem. 67:2115-2123. - PubMed
-
- Becker, A., M. Schmidt, W. Jäger, and A. Pühler. 1995. New gentamicin-resistance and lacZ promoter-probe cassettes suitable for insertion mutagenesis and generation of transcriptional fusions. Gene 162:37-39. - PubMed
-
- Cánovas, J. L., B. F. Johnson, and M. L. Wheelis. 1968. Regulation of the enzymes of the β-ketoadipate pathway in Moraxella calcoacetica. 3. Effects of 3-hydroxy-4-methylbenzoate on the synthesis of enzymes of the protocatechuate branch. Eur. J. Biochem. 3:305-311. - PubMed
Publication types
MeSH terms
Substances
LinkOut - more resources
Full Text Sources
Other Literature Sources
