. 2005 Feb 23;24(4):861-71.
doi: 10.1038/sj.emboj.7600542. Epub 2005 Feb 3.

Reduced hematopoietic reserves in DNA interstrand crosslink repair-deficient Ercc1-/- mice

Affiliations

Reduced hematopoietic reserves in DNA interstrand crosslink repair-deficient Ercc1-/- mice

Joanna M Prasher et al. EMBO J. .

Abstract

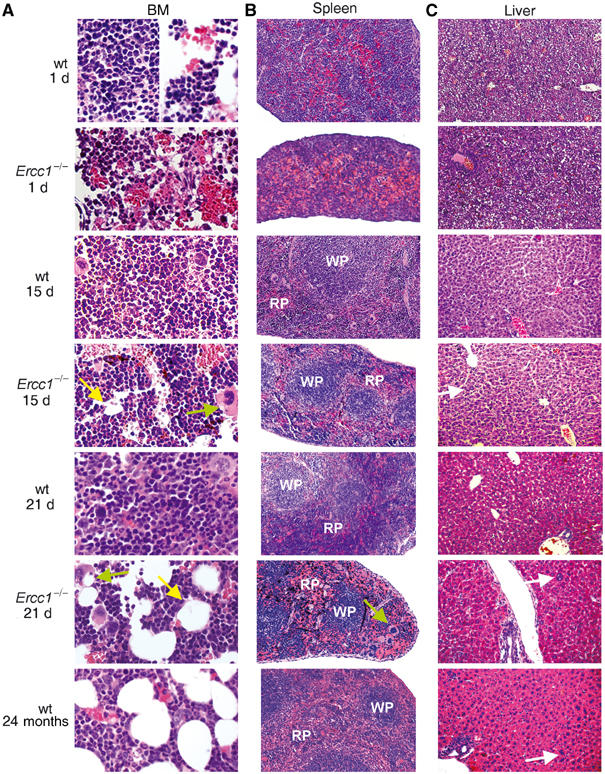
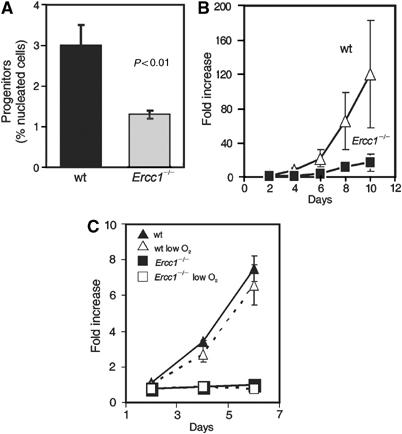
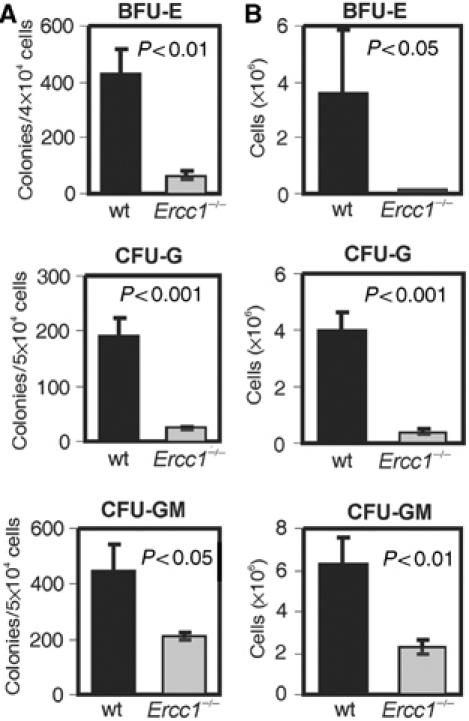
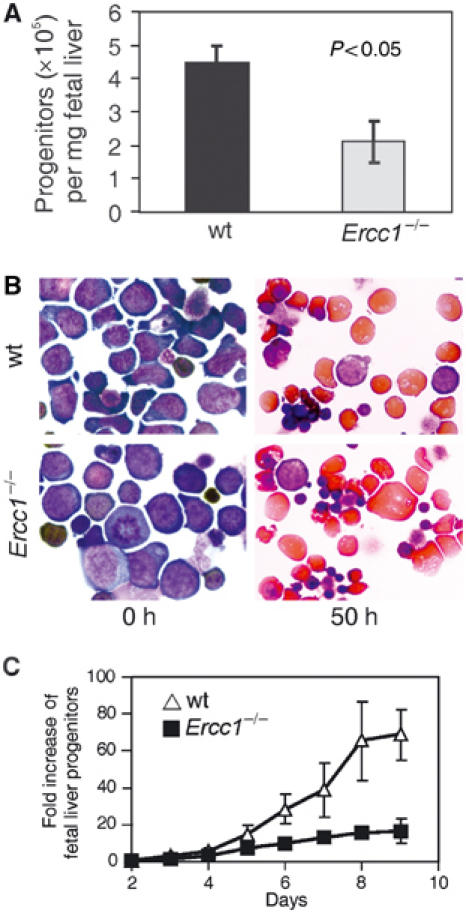
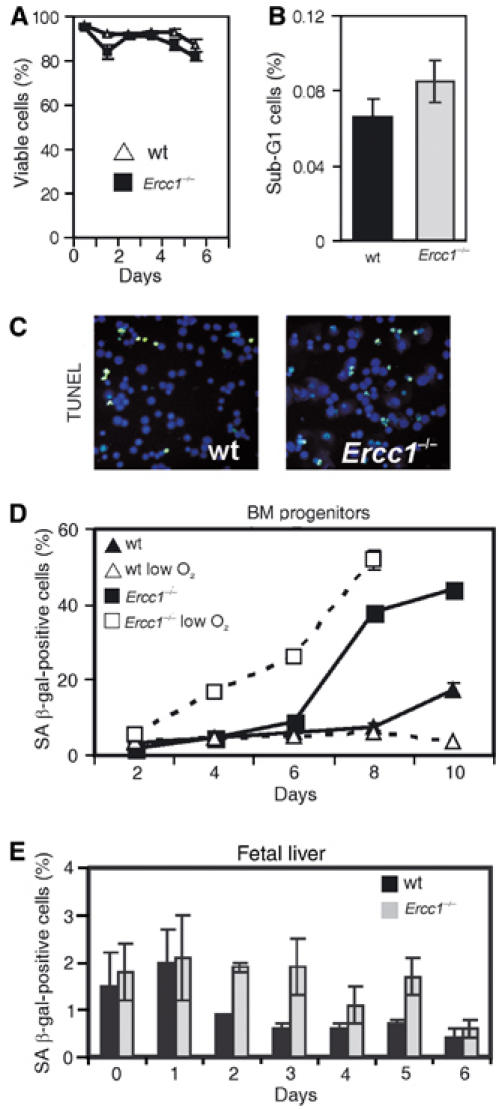
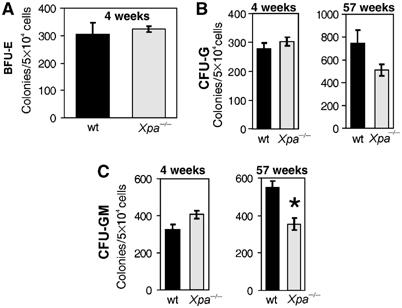
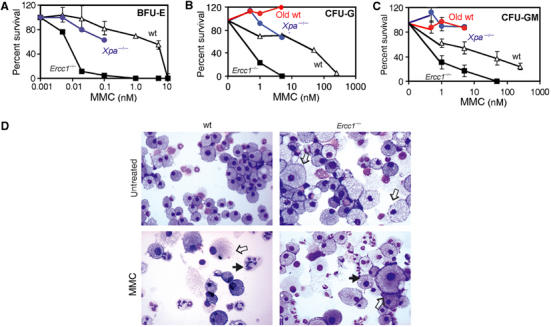
The ERCC1-XPF heterodimer is a structure-specific endonuclease involved in both nucleotide excision repair and interstrand crosslink repair. Mice carrying a genetic defect in Ercc1 display symptoms suggestive of a progressive, segmental progeria, indicating that disruption of one or both of these DNA damage repair pathways accelerates aging. In the hematopoietic system, there are defined age-associated changes for which the cause is unknown. To determine if DNA repair is critical to prolonged hematopoietic function, hematopoiesis in Ercc1-/- mice was compared to that in young and old wild-type mice. Ercc1-/- mice (3-week-old) exhibited multilineage cytopenia and fatty replacement of bone marrow, similar to old wild-type mice. In addition, the proliferative reserves of hematopoietic progenitors and stress erythropoiesis were significantly reduced in Ercc1-/- mice compared to age-matched controls. These features were not seen in nucleotide excision repair-deficient Xpa-/- mice, but are characteristic of Fanconi anemia, a human cancer syndrome caused by defects in interstrand crosslink repair. These data support the hypothesis that spontaneous interstrand crosslink damage contributes to the functional decline of the hematopoietic system associated with aging.


Figures

Figure 1
Figure 1
Progressive systemic hematopoietic deficits in Ercc1−/− mice. (A) Hematoxylin- and eosin-stained histologic sections of the femoral BM space from Ercc1−/− mice and wt littermates at 1, 15 and 21 d of age, as well as from an aged, 2-year-old wt mouse. At 1 d of age, the BM of Ercc1−/− and that of wt mice show equivalent cellularity and areas of erythropoiesis. By 15 d of age, the BM of Ercc1−/− mice shows early signs of fatty replacement (yellow arrow) and accumulation of large debris-laden macrophages (green arrow), which progresses by 21 d of age. Adipose deposition in the BM is a hallmark of aged mice. (B) Splenic sections of the same Ercc1−/− and wt mice. Early postnatal splenic development is unchanged in the Ercc1−/− background. By 15 d of age, there is evidence of replacement of the hematopoietic red pulp (RP; white pulp, WP) by mature erythrocytes in the mutant mice. This becomes exaggerated by 21 d of age in the Ercc1−/− mice and is also seen in the aged wt mouse spleen. Hemosiderin deposition is apparent in the spleens of 15- and 21-d-old Ercc1−/− mice (black deposits), indicating increased erythrocyte death. (C) Liver sections of the same mice. Sections from 1- and 15-d-old wt and Ercc1−/− mice are indistinguishable, showing an equivalent amount of residual hematopoiesis. Thus, Ercc1−/− mice do not have a developmental delay of hematopoiesis. Polyploid nuclei in hepatocytes (white arrows) and perivascular lymphocytic infiltrates are evident in the 21 d Ercc1−/− mouse and aged mouse livers.
Figure 2
Figure 2
Decreased hematopoietic progenitors in Ercc1−/− mice. (A) Progenitors were isolated from 3-week-old Ercc1−/− mice and wt littermates and directly counted. The mean (±s.e.m.) for five pools of mice (2–4 mice per pool) is plotted. (B) Progenitor cells were cultured in a cytokine-rich environment to stimulate maximal proliferation. Every 2 d, cells were counted and the results plotted as fold increase from day 0. Each point represents the mean (±s.e.m.) of at least three samples. (C) Total BM was isolated from 3-week-old mice and plated with lineage-specific cytokines under 20 or 3% (low) oxygen. Progenitor numbers are expressed as fold increase from day 1. Each point represents the mean (±s.e.m.) of three mice.
Figure 3
Figure 3
Lineage-committed progenitor numbers are decreased in Ercc1−/− BM. (A) Hematopoietic progenitors were isolated from 3-week-old mice. The indicated numbers of cells (y-axis) were seeded in methylcellulose with lineage-specific cytokines and grown for 6 d prior to colony counting. Bar graphs represent the mean (±s.e.m.) of at least four independent cell pools (2–4 mice per pool). (B) Outgrowth of cells from lineage-committed progenitors. Following colony counting, cultures were harvested and total cell numbers determined.
Figure 4
Figure 4
Fetal liver progenitor number, but not differentiation capacity, is decreased in Ercc1−/− mice. (A) Fetal liver hematopoietic progenitors were isolated from E12.5 embryos, counted, corrected for liver weight and plotted (±s.e.m.; n⩾4 mice). (B) Erythroid progenitors were plated with cytokines promoting differentiation. Neutral benzidine staining of cytospins demonstrates normal hemoglobin accumulation and cell size reduction in the Ercc1−/− samples. (C) Progenitors isolated from fetal livers of Ercc1−/− (▪) and wt (Δ) mice were plated in a cytokine-rich environment promoting maximal expansion of erythroid progenitors. Cells were counted daily and the results plotted as the fold increase from day 0.
Figure 5
Figure 5
Decreased reserve capacity in the Ercc1−/− fetal liver erythroid progenitor pool is associated with progenitor senescence. (A) Fetal liver progenitor cultures were stained with the vital dye Trypan blue to determine viability at multiple time points after the initiation of cultures. A minimum of 200 cells were analyzed at each time point and the fraction of viable cells plotted. (B) BM progenitors were isolated from 21-d-old Ercc1−/− mice and wt littermates (three pools of two animals each), stained with propidium iodide to determine DNA content and analyzed by flow cytometry. Cells with less than 2N DNA content were gated and the percent calculated from the total number of viable cells. (C) TUNEL assay on fetal liver progenitors. Cells were isolated and cultured under growth-promoting conditions. Replica platings were harvested and analyzed for apoptosis every 24 h after isolation for a total of 8 d. No difference in the fraction of apoptotic cells between Ercc1−/− and wt cultures was detected. An example image from day 5 is depicted. (D) BM progenitors were isolated from femurs of 3-week-old Ercc1−/− mice and wt littermates (n=3, each genotype) and cultured for 10 d under growth-promoting conditions at either 20 or 3% (low) O2. A replicate of the culture was fixed every 2 d and stained for SA β-gal. Positively staining cells were counted and plotted as a percentage (mean±s.e.m.). (E) Fetal liver progenitors were isolated from three mice of each genotype and cultured as described in (A), then washed, fixed and stained for SA β-gal. The percentage of positively staining, senescent cells is plotted (mean±s.e.m.).
Figure 6
Figure 6
Normal progenitor pools in NER-deficient Xpa−/− mice. Hematopoietic progenitor cells were isolated from young (4 weeks) and old (56–58 weeks) wt (black bars) and Xpa−/− (gray bars) mice and plated in CFU-G or CFU-GM (or in the case of young mice BFU-E) stimulating cytokine conditions. The colony numbers were counted on the 6th d of culture. The mean (±s.e.m.) of three cell pools (two mice per pool) is shown for the young mice and three individual animals for the aged mice. The only significant difference between wt and Xpa−/− hematopoietic progenitor activity was detected in the aged mice and was restricted to the granulocyte–macrophage lineage (*P<0.05).
Figure 7
Figure 7
Hypersensitivity of Ercc1−/− progenitors to ICL damage. Progenitor cells from 3-week-old wt (Δ), Ercc1−/− (▪) or Xpa−/− (blue •) mice and 78-week-old wt (red •) mice were assayed for BFU-E (A), CFU-G (B) and CFU-GM (C) activity in the presence of increasing concentrations of the crosslinking agent MMC. Colonies were counted after 6 d in culture. Each data point represents the mean colony number (±s.e.m. from at least three cell pools) as a percentage of the colony number detected in untreated samples. (D) Cytology of wt and Ercc1−/− CFU-GM cultures before and after exposure to 50 or 1 nM MMC, respectively. Filled arrows indicate nuclear fragmentation; open arrows indicate enlarged macrophages.

Similar articles

Cited by

References

    1. Alter BP, Knobloch ME, Weinberg RS (1991) Erythropoiesis in Fanconi's anemia. Blood 78: 602–608 - PubMed
    1. Bagnara GP, Strippoli P, Bonsi L, Brizzi MF, Avanzi GC, Timeus F, Ramenghi U, Piaggio G, Tong J, Podesta M, Paolucci G, Pegoraro L, Gabutti V, Bacigalupo A (1992) Effect of stem cell factor on colony growth from acquired and constitutional (Fanconi) aplastic anemia. Blood 80: 382–387 - PubMed
    1. Balducci L, Extermann M (1997) Cancer chemotherapy in the older patient: what the medical oncologist needs to know. Cancer 80: 1317–1322 - PubMed
    1. Barja G (2002) Rate of generation of oxidative stress-related damage and animal longevity. Free Radic Biol Med 33: 1167–1172 - PubMed
    1. Bauer A, Tronche F, Wessely O, Kellendonk C, Reichardt HM, Steinlein P, Schutz G, Beug H (1999) The glucocorticoid receptor is required for stress erythropoiesis. Genes Dev 13: 2996–3002 - PMC - PubMed

Publication types

MeSH terms