

Use of a human visual system model to predict observer performance with CRT vs LCD display of images
- PMID: 15692869
- PMCID: PMC3047185
- DOI: 10.1007/s10278-004-1016-4
Use of a human visual system model to predict observer performance with CRT vs LCD display of images
Abstract
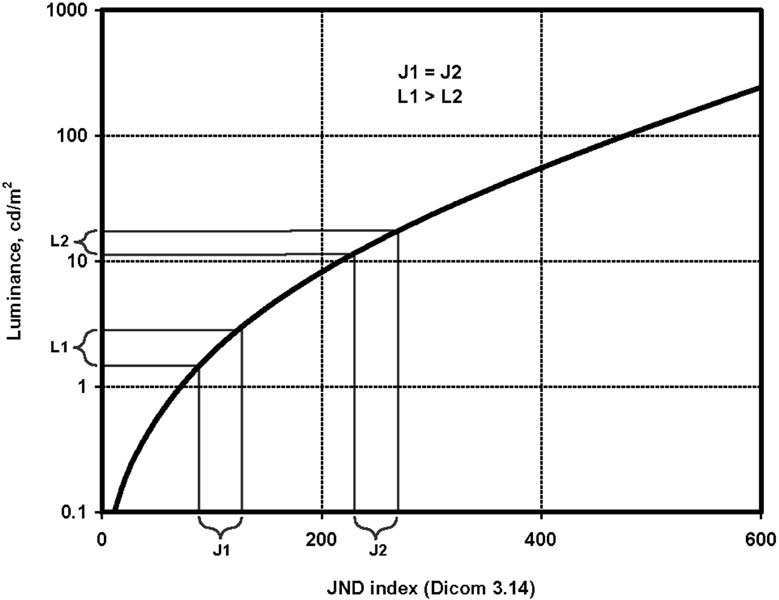
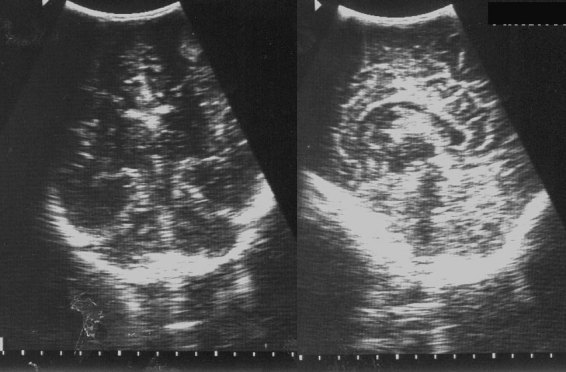
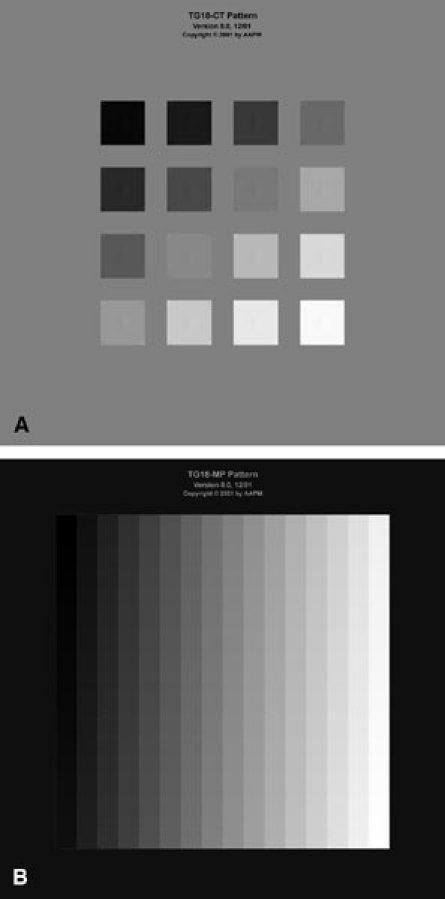
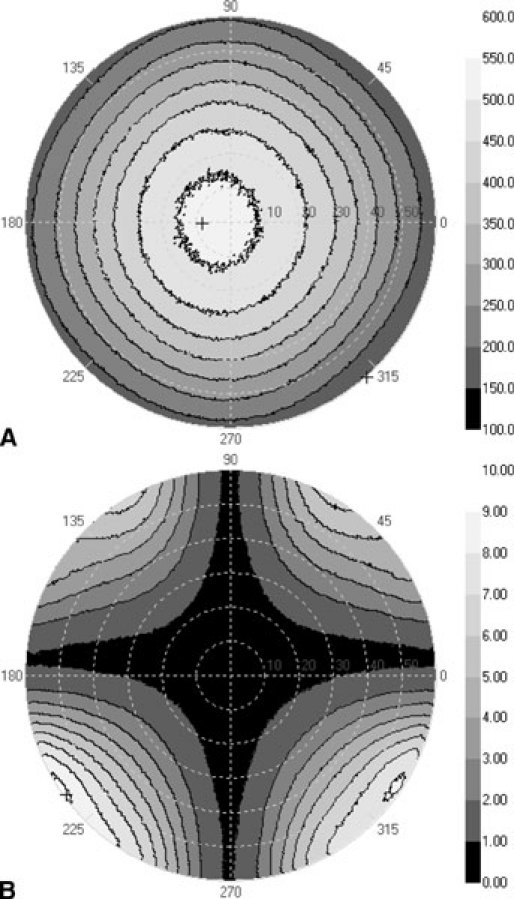
This Project evaluated a human visual system model (JNDmetrix) based on just noticeable difference (JND) and frequency-channel vision-modeling principles to assess whether a Cathode ray tube (CRT) or a liquid crystal display (LCD) monochrome display monitor would yield better observer performance in radiographic interpretation. Key physical characteristics, such as veiling glare and modulation transfer function (MTF) of the CRT and LCD were measured. Regions of interest from mammographic images with masses of different contrast levels were shown once on each display to six radiologists using a counterbalanced presentation order. The images were analyzed using the JNDmetrix model. Performance as measured by receiver operating characteristic (ROC) analysis was significantly better overall on the LCD display (P = 0.0120). The JNDmetrix model predicted the result (P = 0.0046) and correlation between human and computer observers was high (r (2) (quadratic) = 0.997). The results suggest that observer performance with LCD displays is superior to CRT viewing, at least for on-axis viewing.
Figures
References
-
- Sinha U, Bui A, Taira R, et al. A review of medical imaging informatics. Ann Med Imaging Inform. 2002;980:168–197. - PubMed
-
- Horii SC. Workstations. In: Mehta A, Dreyer KJ, Thrall JH, editors. PACS: A Guide to the Digital Revolution. New York: Springer-Verlag; 2002. pp. 191–235.
Publication types
MeSH terms
Grants and funding
LinkOut - more resources
Full Text Sources
Research Materials
Miscellaneous
