

Variation in tissue-specific gene expression among natural populations
- PMID: 15693942
- PMCID: PMC551533
- DOI: 10.1186/gb-2005-6-2-r13
Variation in tissue-specific gene expression among natural populations
Abstract
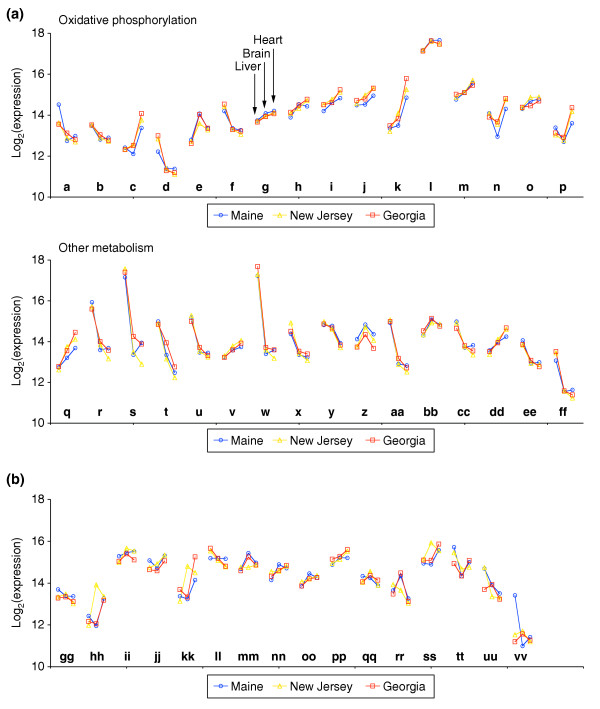
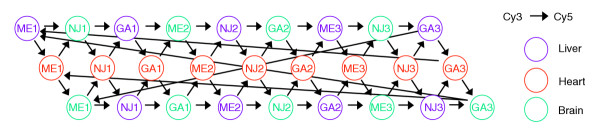
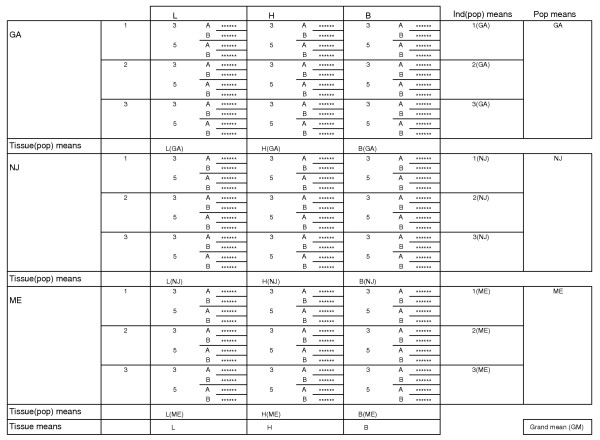
Background: Variation in gene expression is extensive among tissues, individuals, strains, populations and species. The interactions among these sources of variation are relevant for physiological studies such as disease or toxic stress; for example, it is common for pathologies such as cancer, heart failure and metabolic disease to be associated with changes in tissue-specific gene expression or changes in metabolic gene expression. But how conserved these differences are among outbred individuals and among populations has not been well documented. To address this we examined the expression of a selected suite of 192 metabolic genes in brain, heart and liver in three populations of the teleost fish Fundulus heteroclitus using a highly replicated experimental design.
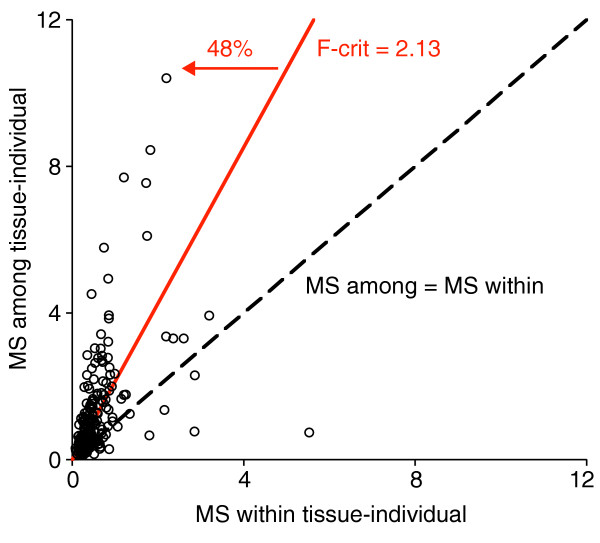
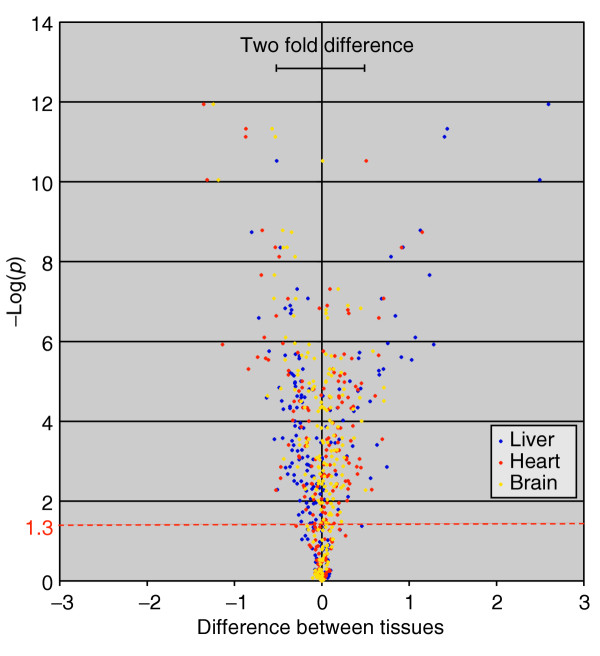
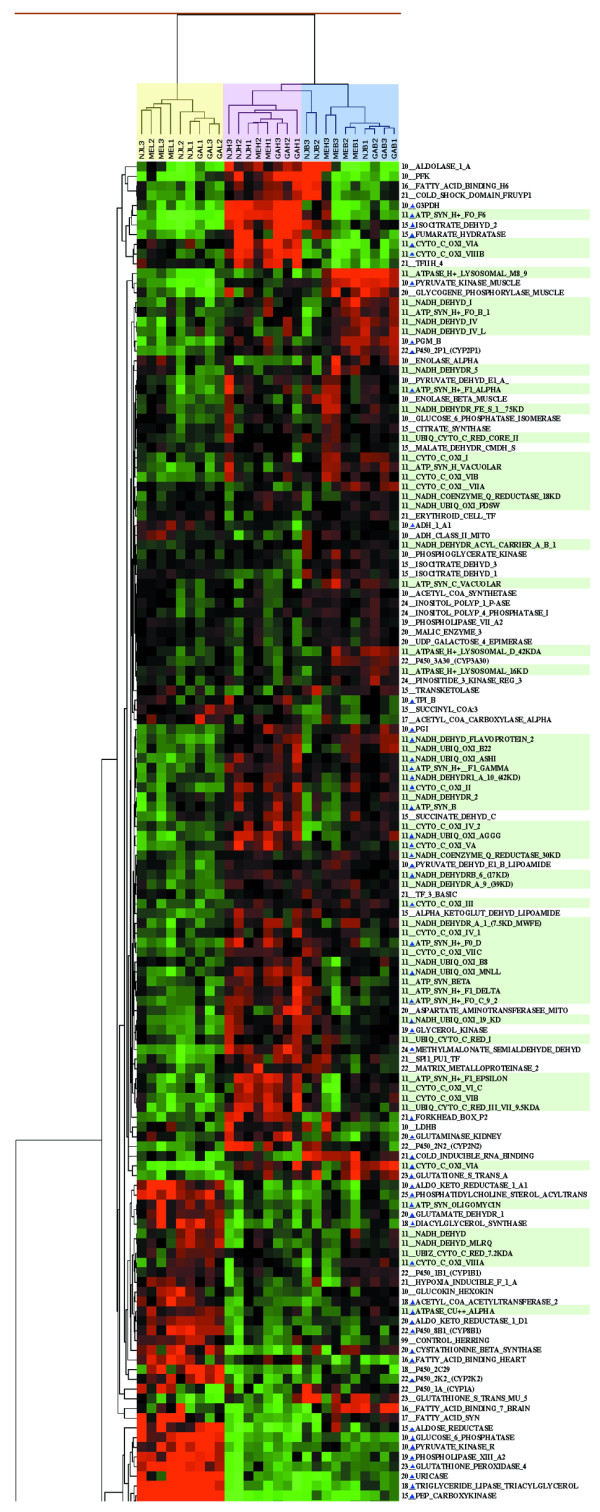
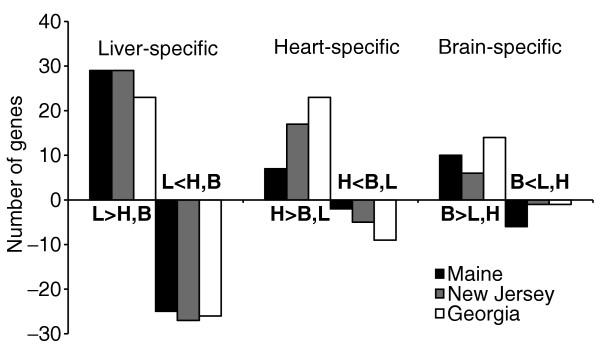
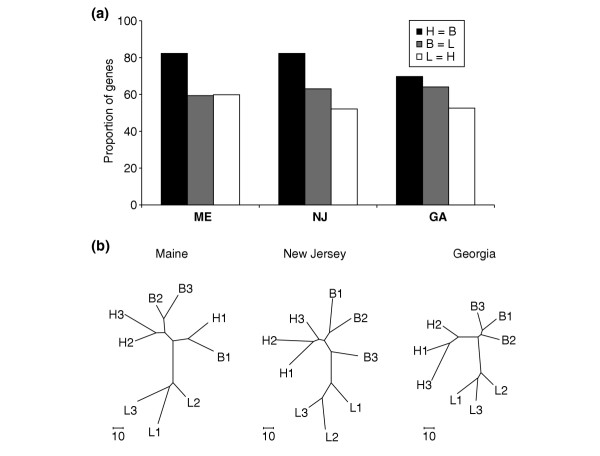
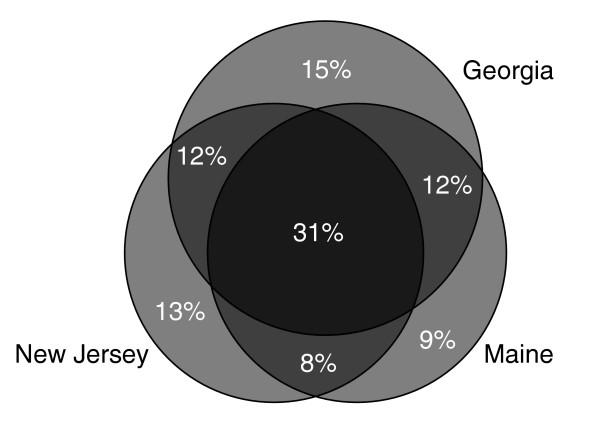
Results: Half of the genes (48%) were differentially expressed among individuals within a population-tissue group and 76% were differentially expressed among tissues. Differences among tissues reflected well established tissue-specific metabolic requirements, suggesting that these measures of gene expression accurately reflect changes in proteins and their phenotypic effects. Remarkably, only a small subset (31%) of tissue-specific differences was consistent in all three populations.
Conclusions: These data indicate that many tissue-specific differences in gene expression are unique to one population and thus are unlikely to contribute to fundamental differences between tissue types. We suggest that those subsets of treatment-specific gene expression patterns that are conserved between taxa are most likely to be functionally related to the physiological state in question.
Figures
Similar articles
-
Natural variation in cardiac metabolism and gene expression in Fundulus heteroclitus.Nat Genet. 2005 Jan;37(1):67-72. doi: 10.1038/ng1483. Epub 2004 Nov 28. Nat Genet. 2005. PMID: 15568023 Free PMC article.
-
The biological importance of measuring individual variation.J Exp Biol. 2007 May;210(Pt 9):1613-21. doi: 10.1242/jeb.005454. J Exp Biol. 2007. PMID: 17449827
-
Convergence and divergence in gene expression among natural populations exposed to pollution.BMC Genomics. 2007 Apr 25;8:108. doi: 10.1186/1471-2164-8-108. BMC Genomics. 2007. PMID: 17459166 Free PMC article.
-
Phenotypic plasticity in gene expression contributes to divergence of locally adapted populations of Fundulus heteroclitus.Mol Ecol. 2015 Jul;24(13):3345-59. doi: 10.1111/mec.13188. Epub 2015 May 27. Mol Ecol. 2015. PMID: 25847331
-
The relationship between phenotypic and environmental variation: do physiological responses reduce interindividual differences?Physiol Biochem Zool. 2012 Nov-Dec;85(6):572-84. doi: 10.1086/666904. Epub 2012 Jul 31. Physiol Biochem Zool. 2012. PMID: 23099455 Review.
Cited by
-
mRNA profiling using a minimum of five mRNA markers per body fluid and a novel scoring method for body fluid identification.Int J Legal Med. 2013 Jul;127(4):707-21. doi: 10.1007/s00414-012-0794-3. Epub 2012 Dec 20. Int J Legal Med. 2013. PMID: 23254458
-
Genetic dissection of gene regulation in multiple mouse tissues.Mamm Genome. 2006 Jun;17(6):490-5. doi: 10.1007/s00335-005-0186-9. Epub 2006 Jun 12. Mamm Genome. 2006. PMID: 16783630 Review.
-
SNP identification, verification, and utility for population genetics in a non-model genus.BMC Genet. 2010 Apr 30;11:32. doi: 10.1186/1471-2156-11-32. BMC Genet. 2010. PMID: 20433726 Free PMC article.
-
Impact of putatively beneficial genomic loci on gene expression in little brown bats (Myotis lucifugus, Le Conte, 1831) affected by white-nose syndrome.Evol Appl. 2024 Sep 19;17(9):e13748. doi: 10.1111/eva.13748. eCollection 2024 Sep. Evol Appl. 2024. PMID: 39310794 Free PMC article.
-
Hepatic carbamoyl phosphate synthetase (CPS) I and urea contents in the hylid tree frog, Litoria caerulea: transition from CPS III to CPS I.J Comp Physiol B. 2012 Dec;182(8):1081-94. doi: 10.1007/s00360-012-0682-7. Epub 2012 Jun 27. J Comp Physiol B. 2012. PMID: 22736308
References
Publication types
MeSH terms
Grants and funding
LinkOut - more resources
Full Text Sources
Other Literature Sources
Molecular Biology Databases
