. 2005;6(2):R15.
doi: 10.1186/gb-2005-6-2-r15. Epub 2005 Jan 21.

Polarized monocyte response to cytokine stimulation

Affiliations

Polarized monocyte response to cytokine stimulation

Dirk Nagorsen et al. Genome Biol. 2005.

Abstract

Background: Mononuclear phagocytes (MPs) stand at the crossroads between the induction of acute inflammation to recruit and activate immune effector cells and the downmodulation of the inflammatory process to contain collateral damage. This decision is extensively modulated by the cytokine microenvironment, which includes a broad array of cytokines whose direct effect on MPs remains largely unexplored. Therefore, we tested whether polarized responses of MPs to pathogens are related to the influence of selected cytokines or represent a mandatory molecular switch through which most cytokines operate.

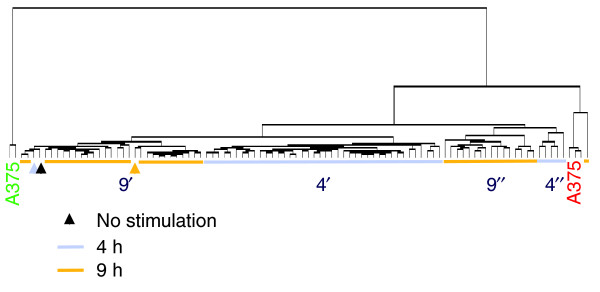
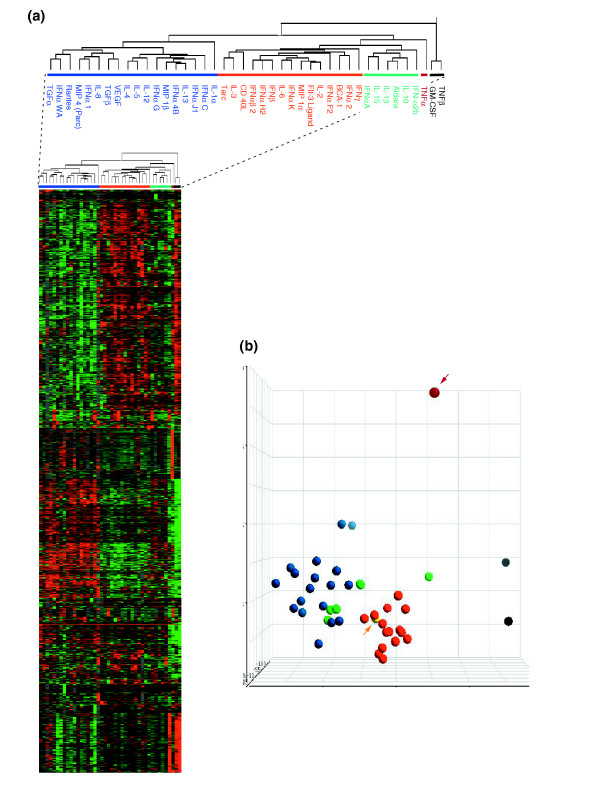
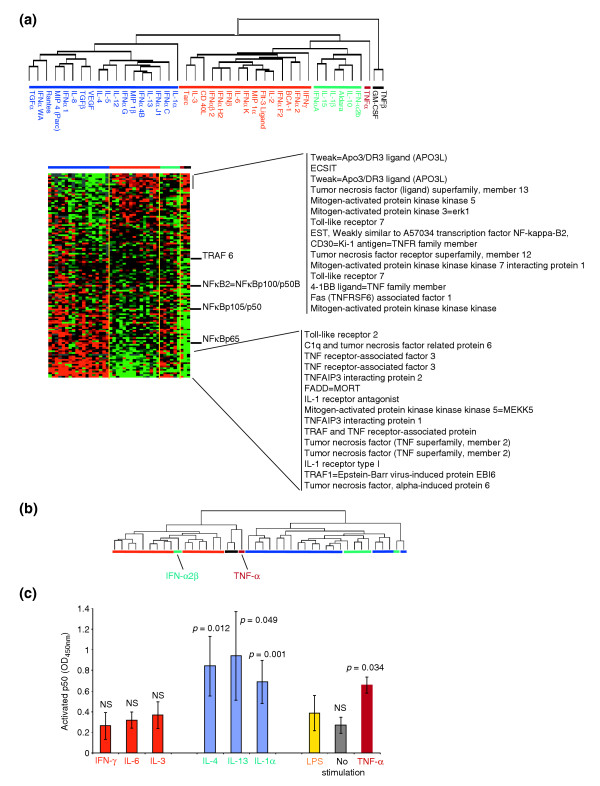
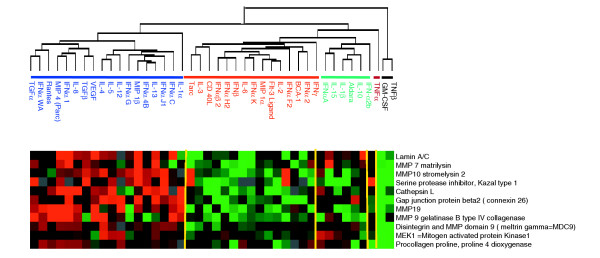
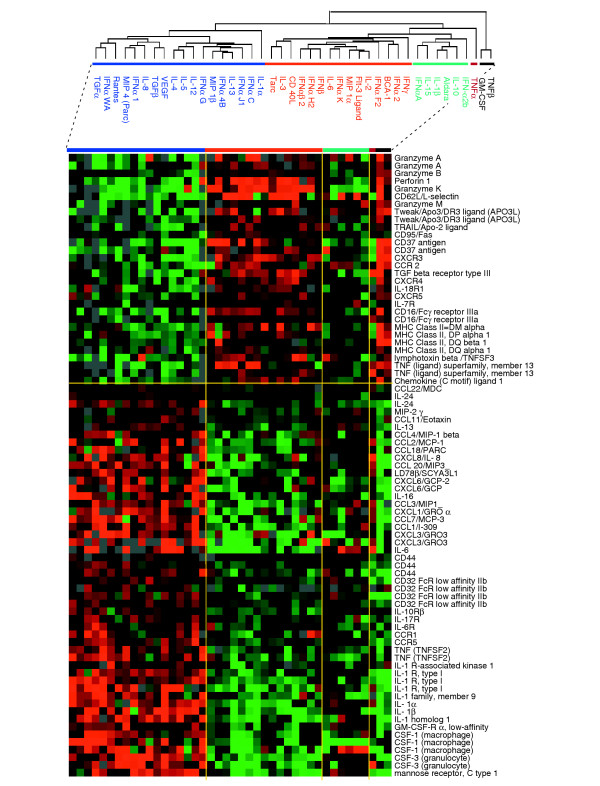
Results: Circulating CD14+ MPs were exposed to bacterial lipopolysaccharide (LPS) followed by exposure to an array of cytokines, chemokines and soluble factors involved in the immune response. Gene expression was studied by global transcript analysis. Two main classes of cytokines were identified that induced a classical or an alternative pathway of MP activation. Expression of genes affected by NFkappaB activation was most predictive of the two main classes, suggesting that this pathway is a fundamental target of cytokine regulation. As LPS itself induces a classical type of activation, the most dramatic modulation was observed toward the alternative pathway, suggesting that a broad array of cytokines may counteract the pro-inflammatory effects of bacterial components.

Conclusions: This analysis is directly informative of the primary effect of individual cytokines on the early stages of LPS stimulation and, therefore, may be most informative of the way MP maturation may be polarized at the early stages of the immune response.


Figures

Figure 1
Figure 1
Unsupervised clustering of LPS-stimulated CD14+ MPs exposed to distinct cytokine treatments. CD14+ MPs were stimulated in parallel with LPS and exposed after 1 h to 42 individual cytokines (see Table 1 for cytokines used). Antisense RNA obtained 4 and 9 h following LPS stimulation was hybridized to custom-made 17K cDNA arrays. Unsupervised Eisen clustering [12] was applied to the complete, unfiltered dataset of 98 experiments. Arrowheads represent control samples that did not receive any stimulation and were obtained at different time points to parallel culture conditions during stimulation (0, 4 and 9 h). Light blue and gold represent samples obtained 4 and 9 h after stimulation, respectively and black represents no stimulation. A375 is a melanoma cell line that was used for quality control alternating conventional (Cy5, red) or reciprocal (Cy3, green) labeling every 25 experiments as previously described [9]. Experiments cluster closer together according to time rather than type of stimulation, with samples obtained after 4 h clustering together (4') with the exception of few cytokines (4"). With few exceptions (9"), cytokine treatments at 9 h clustered together with non-stimulated MPs (9').
Figure 2
Figure 2
Definition of cytokine classes based on their modulatory effect on the response of CD14+ circulating MP to LPS. (a) Definition of cytokine classes based on their modulatory effect on the response of CD14+ circulating MPs to LPS. CD14+ MPs were stimulated with LPS and exposed after 1 h to 42 individual cytokine stimulations. The clusterogram represents 2,057 genes obtained by Eisen hierarchical clustering of the complete 17K dataset filtered for genes that are expressed in a minimum of 80% of the samples 4 h after LPS stimulation, and that, at least in one experiment, displayed a greater than threefold change in expression over stimulation with LPS alone. Two main classes of cytokines are distinguished: the blue bar indicates type II cytokines (for example, IL-4 and IL-13) and the red bar indicates type I cytokines (such as IFN-γ, CD40L and FLT-3L). A smaller third class including IL-10 is also shown (green bar). TNF-α (purple bar), TNF-β and GM-CSF (dark-gray bars) clustered separately from all other cytokines. (b) Unsupervised principal component analysis (PCA) of the unfiltered 17K gene dataset. Cytokine treatments are color-coded according to the groups classified in (a): blue circles, alternative type I cytokines; green circles, alternative type II cytokines; red circles, classical cytokines; purple circle (arrowed), TNF-α; dark-gray circles, TNF-β and GM-CSF; yellow circle (arrowed), LPS alone.
Figure 3
Figure 3
Effect of cytokines on the expression of genes dependent on NFκB activation. (a) One hundred and twenty-one genes associated with the downstream effects of NFκB activation were selected from the unfiltered 17K gene dataset and reclustered without changing the cytokine treatment grouping as per Figure 2. The genes most significantly different in expression between the two classes are listed on the right. (b) All samples were reclustered (dendrogram) using the 121 genes described in (a). Color coding is identical to that in Figure 2. (c) The histogram depicts detection of the free NFκB subunit p50 in four consecutive experiments. p = p2 value, NS, nonsignificant. Blue bars, MPs stimulated with LPS (1 h) + alternative cytokines (additional 30 min stimulation); red bars, classical cytokines; yellow bar, MPs stimulated with LPS alone; gray bar, unstimulated MP control; purple bar, TNF-α alternative II class of cytokines.
Figure 4
Figure 4
Effect of cytokines on the expression of genes for matrix metalloproteinases (MMPs) and MMP-related genes. MMP genes and MMP-related genes (such as disintegrins, IFN-γ and related genes, IFN-α, α-defensins, TGF-β, TNF-α, IGF-1, EGF, FGF, IL-1, MCP-3 - complete list available from the authors on request) were clustered according to the alternative and classical groups and filtered for 70% presence and at least one value equal to or greater than a 1.5-fold change in expression (a total of 36 genes). The clusterogram displays 11 of the most representative genes. Color coding is as Figure 2.
Figure 5
Figure 5
Selection of genes differentially expressed between classically and alternatively activated MPs based on previous annotations linking their function to MP activation. Eighty-one representative genes with known MP-associated function are shown among 2,007 genes differentially expressed (p2 < 0.001, Student's t-test). The nomenclature for chemokines and chemokine receptors follows the recommendations of the IUIS/WHO subcommittee on chemokine nomenclature [44]. Color coding as in Figure 2.
Figure 6
Figure 6
Induction of gene expression by stimulation of LPS-activated MPs with IFN-γ and IL-4. MPs obtained from PBMC from five normal donors were stimulated for 4 h with one cytokine representative of the alternative (IL-4) and one of the classical group (IFN-γ) and gene transcription measured by TaqMan real-time PCR. The relative quantification of 10 genes was calculated by normalizing the ratio of the mean copy number for each gene with the mean copy number of the reference AFAP gene in MPs from five donors. Statistically significant differences (p-value < 0.05) between the two cytokine treatments as assessed by Student's t-test are represented by an asterisk.
Figure 7
Figure 7
Induction of gene expression by cytokines of the alternative and classical groups. MPs derived from PBMC from five normal donors were stimulated for 4 h with four cytokines/soluble factors selected from the alternative group (IL-13, IL-1α, IL-4, TGF-β) and four from the classical group (FLT-3 L, IFN-γ, IL-3, CD40L). Gene expression was assessed by TaqMan real-time PCR. Relative estimates of (a) mannose receptor, (b) NFκB and (c) TRAF binding protein genes were calculated by averaging the ratio of the quantity mean of each gene normalized to the reference AFAP gene in five donors. Statistical significance is expressed as Student's t-test p-value.

Similar articles

Cited by

References

    1. Mantovani A, Sozzani S, Locati M, Allavena P, Sica A. Macrophage polarization: tumor-associated macrophages as a paradigm for polarized M2 mononuclear phagocytes. Trends Immunol. 2002;23:549–555. doi: 10.1016/S1471-4906(02)02302-5. - DOI - PubMed
    1. Takeda K, Kaisho T, Akira S. Toll-like receptors. Annu Rev Immunol. 2003;21:335–376. doi: 10.1146/annurev.immunol.21.120601.141126. - DOI - PubMed
    1. Anderson KV. Toll signaling pathways in the innate immune response. Curr Opin Immunol. 2000;12:13–19. doi: 10.1016/S0952-7915(99)00045-X. - DOI - PubMed
    1. Mocellin S, Panelli MC, Wang E, Nagorsen D, Marincola FM. The dual role of IL-10. Trends Immunol. 2003;24:36–43. doi: 10.1016/S1471-4906(02)00009-1. - DOI - PubMed
    1. Gordon S. Alternative activation of macrophages. Nat Rev Immunol. 2003;3:23–35. doi: 10.1038/nri978. - DOI - PubMed

MeSH terms