

Preferred analysis methods for Affymetrix GeneChips revealed by a wholly defined control dataset
- PMID: 15693945
- PMCID: PMC551536
- DOI: 10.1186/gb-2005-6-2-r16
Preferred analysis methods for Affymetrix GeneChips revealed by a wholly defined control dataset
Abstract
Background: As more methods are developed to analyze RNA-profiling data, assessing their performance using control datasets becomes increasingly important.
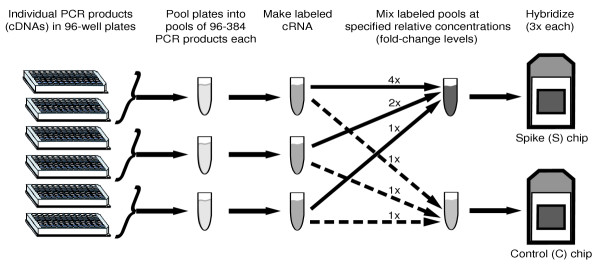
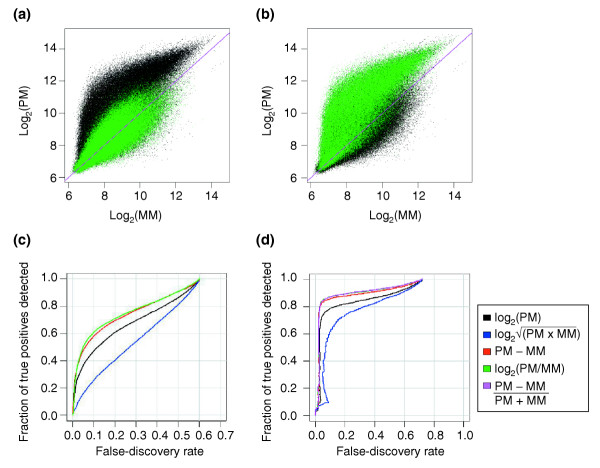
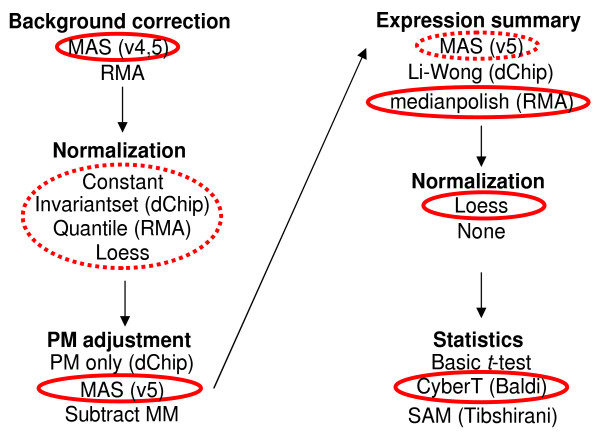
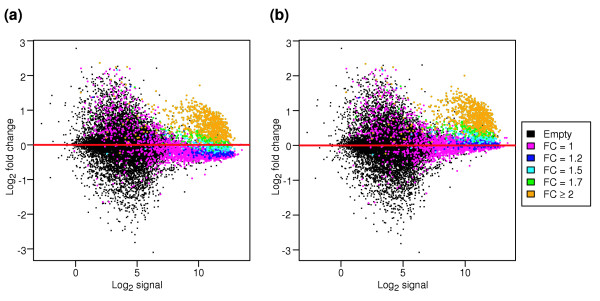
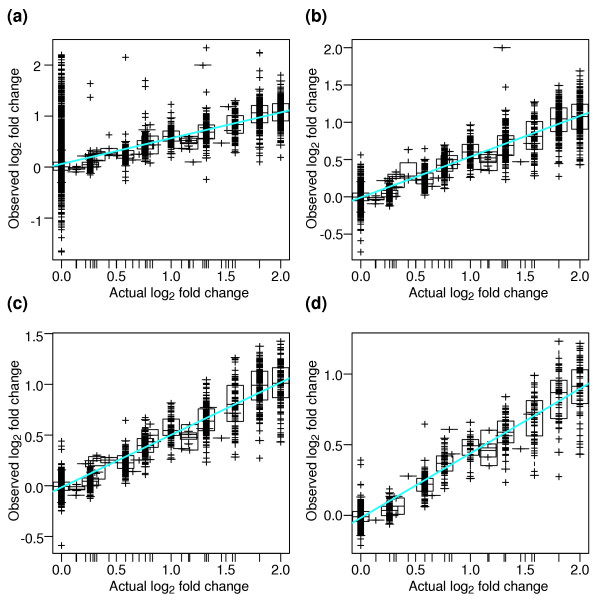
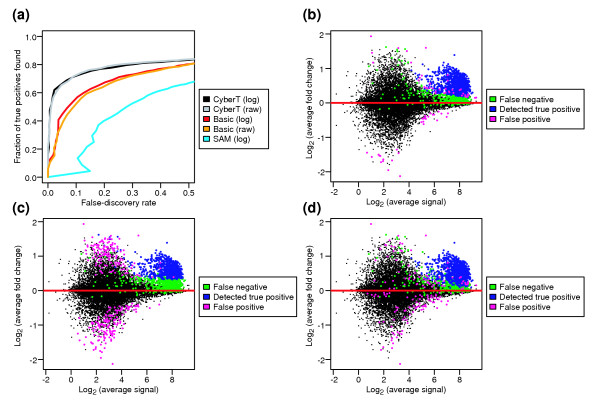
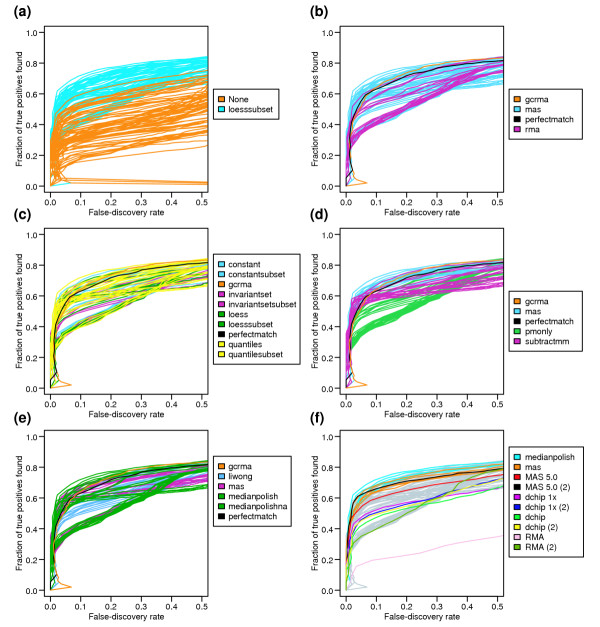
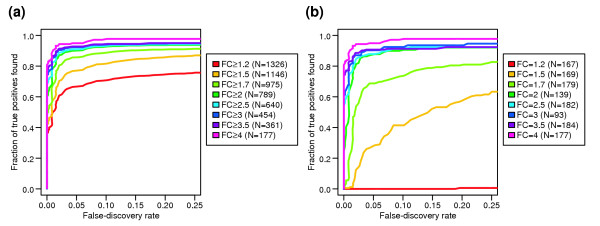
Results: We present a 'spike-in' experiment for Affymetrix GeneChips that provides a defined dataset of 3,860 RNA species, which we use to evaluate analysis options for identifying differentially expressed genes. The experimental design incorporates two novel features. First, to obtain accurate estimates of false-positive and false-negative rates, 100-200 RNAs are spiked in at each fold-change level of interest, ranging from 1.2 to 4-fold. Second, instead of using an uncharacterized background RNA sample, a set of 2,551 RNA species is used as the constant (1x) set, allowing us to know whether any given probe set is truly present or absent. Application of a large number of analysis methods to this dataset reveals clear variation in their ability to identify differentially expressed genes. False-negative and false-positive rates are minimized when the following options are chosen: subtracting nonspecific signal from the PM probe intensities; performing an intensity-dependent normalization at the probe set level; and incorporating a signal intensity-dependent standard deviation in the test statistic.
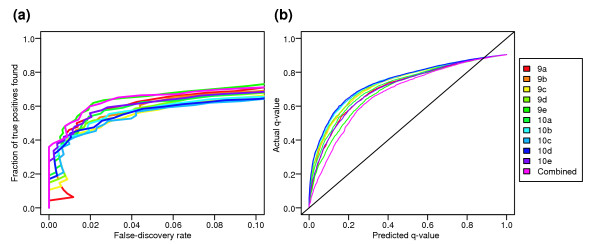
Conclusions: A best-route combination of analysis methods is presented that allows detection of approximately 70% of true positives before reaching a 10% false-discovery rate. We highlight areas in need of improvement, including better estimate of false-discovery rates and decreased false-negative rates.
Figures
Comment in
-
A reanalysis of a published Affymetrix GeneChip control dataset.Genome Biol. 2006;7(3):401. doi: 10.1186/gb-2006-7-3-401. Epub 2006 Mar 22. Genome Biol. 2006. PMID: 16563185 Free PMC article.
-
Feature-level exploration of a published Affymetrix GeneChip control dataset.Genome Biol. 2006;7(8):404. doi: 10.1186/gb-2006-7-8-404. Genome Biol. 2006. PMID: 16953902 Free PMC article.
Similar articles
-
Feature-level exploration of a published Affymetrix GeneChip control dataset.Genome Biol. 2006;7(8):404. doi: 10.1186/gb-2006-7-8-404. Genome Biol. 2006. PMID: 16953902 Free PMC article.
-
Preferred analysis methods for Affymetrix GeneChips. II. An expanded, balanced, wholly-defined spike-in dataset.BMC Bioinformatics. 2010 May 27;11:285. doi: 10.1186/1471-2105-11-285. BMC Bioinformatics. 2010. PMID: 20507584 Free PMC article.
-
Probe-level linear model fitting and mixture modeling results in high accuracy detection of differential gene expression.BMC Bioinformatics. 2006 Aug 25;7:391. doi: 10.1186/1471-2105-7-391. BMC Bioinformatics. 2006. PMID: 16934150 Free PMC article.
-
Comparison of seven methods for producing Affymetrix expression scores based on False Discovery Rates in disease profiling data.BMC Bioinformatics. 2005 Feb 10;6:26. doi: 10.1186/1471-2105-6-26. BMC Bioinformatics. 2005. PMID: 15705192 Free PMC article.
-
A reanalysis of a published Affymetrix GeneChip control dataset.Genome Biol. 2006;7(3):401. doi: 10.1186/gb-2006-7-3-401. Epub 2006 Mar 22. Genome Biol. 2006. PMID: 16563185 Free PMC article.
Cited by
-
Isoflavones in soy flour diet have different effects on whole-genome expression patterns than purified isoflavone mix in human MCF-7 breast tumors in ovariectomized athymic nude mice.Mol Nutr Food Res. 2015 Aug;59(8):1419-30. doi: 10.1002/mnfr.201500028. Epub 2015 Jun 26. Mol Nutr Food Res. 2015. PMID: 25820259 Free PMC article.
-
Fully moderated T-statistic for small sample size gene expression arrays.Stat Appl Genet Mol Biol. 2011 Sep 15;10(1):42. doi: 10.2202/1544-6115.1701. Stat Appl Genet Mol Biol. 2011. PMID: 23089813 Free PMC article.
-
Distinct cardiac transcriptional profiles defining pregnancy and exercise.PLoS One. 2012;7(7):e42297. doi: 10.1371/journal.pone.0042297. Epub 2012 Jul 31. PLoS One. 2012. PMID: 22860109 Free PMC article.
-
Revisiting Fold-Change Calculation: Preference for Median or Geometric Mean over Arithmetic Mean-Based Methods.Biomedicines. 2024 Jul 23;12(8):1639. doi: 10.3390/biomedicines12081639. Biomedicines. 2024. PMID: 39200104 Free PMC article.
-
A WNT/p21 circuit directed by the C-clamp, a sequence-specific DNA binding domain in TCFs.Mol Cell Biol. 2012 Sep;32(18):3648-62. doi: 10.1128/MCB.06769-11. Epub 2012 Jul 9. Mol Cell Biol. 2012. PMID: 22778133 Free PMC article.
References
-
- Schena M, Shalon D, Davis RW, Brown PO. Quantitative monitoring of gene expression patterns with a complementary DNA microarray. Science. 1995;270:467–470. - PubMed
-
- Parmigiani G, Garrett ES, Irizarry RA, Zeger SL. The analysis of gene expression data. New York: Springer Verlag; 2003.
-
- Barash Y, Dehan E, Krupsky M, Franklin W, Geraci M, Friedman N, Kaminski N. Comparative analysis of algorithms for signal quantitation from oligonucleotide microarrays. Bioinformatics Adv Access. 2004;1:1. - PubMed
Publication types
MeSH terms
Substances
Grants and funding
LinkOut - more resources
Full Text Sources
Other Literature Sources
Research Materials
