

doi: 10.1186/gb-2005-6-2-r18.
Epub 2005 Jan 26.
Fast and systematic genome-wide discovery of conserved regulatory elements using a non-alignment based approach
Affiliations
- PMID: 15693947
- PMCID: PMC551538
- DOI: 10.1186/gb-2005-6-2-r18
Item in Clipboard
Fast and systematic genome-wide discovery of conserved regulatory elements using a non-alignment based approach
Genome Biol.
2005.
Abstract
We describe a powerful new approach for discovering globally conserved regulatory elements between two genomes. The method is fast, simple and comprehensive, without requiring alignments. Its application to pairs of yeasts, worms, flies and mammals yields a large number of known and novel putative regulatory elements. Many of these are validated by independent biological observations, have spatial and/or orientation biases, are co-conserved with other elements and show surprising conservation across large phylogenetic distances.
Figures
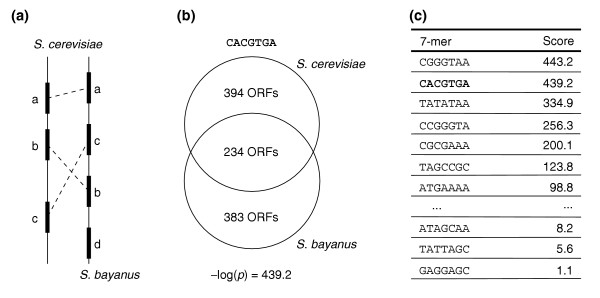
Overview of the FastCompare approach. (a) Determination of orthologous pairs of ORFs, and extraction of the associated upstream regions (data not shown). (b) For each k-mer (here CACGTGA), determination of the sets of ORFs that contain it in their upstream regions, in each species separately. The conservation score (hypergeometric p-values to assess the overlap between both sets) is then calculated. (c) Ranking of all k-mers on the basis of their conservation scores.
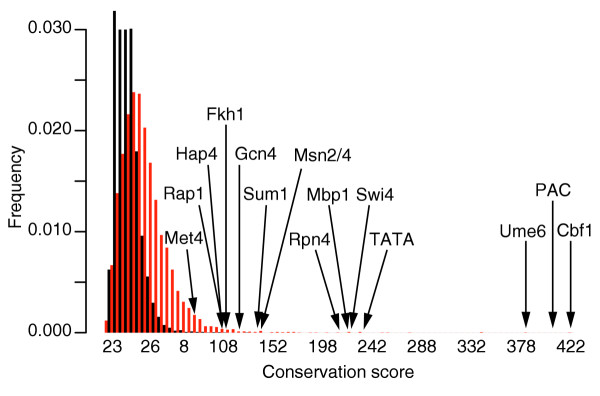
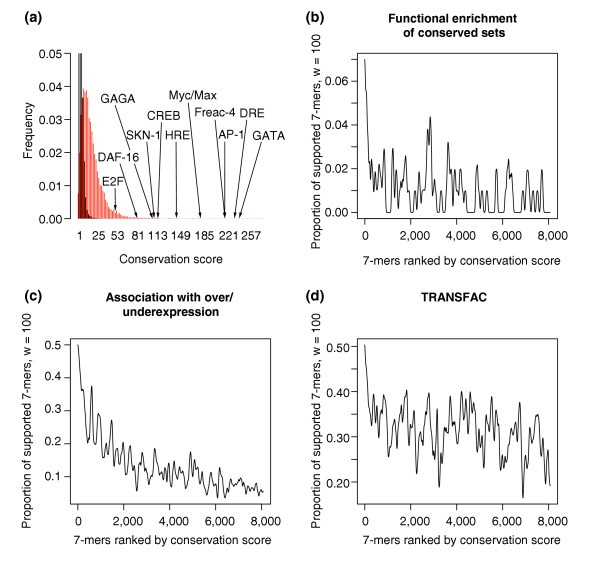
Distributions of conservation scores for actual (red) and randomized (black) data obtained when applying FastCompare to S. cerevisiae and S. bayanus. Both distributions were constructed using bin sizes of 5. The top portion of the figure is not shown for the purpose of presentation. The distributions show that high conservation scores are unlikely to be obtained from randomized data. Also, a large number of 7-mers on the tail of the distribution correspond to experimentally verified transcription-factor-binding sites in yeast.
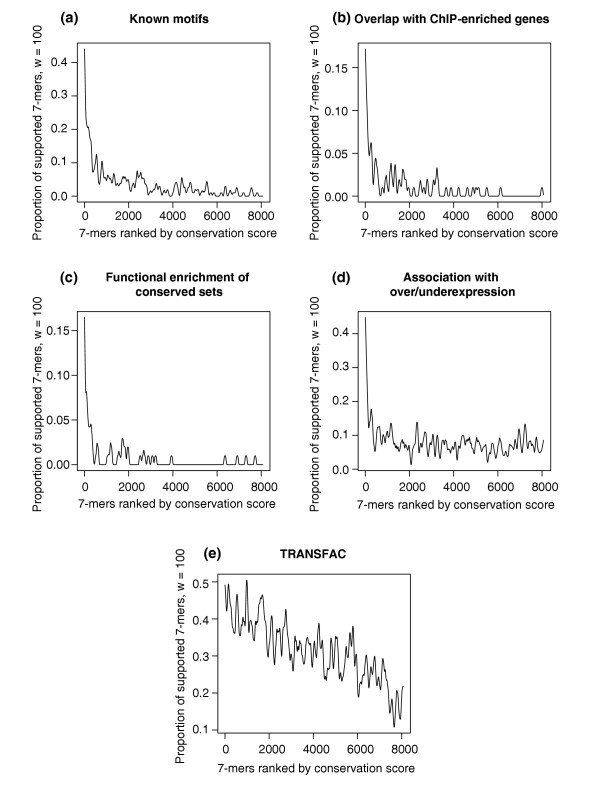
Proportions of 7-mers supported by different types of independent biological data ((a) known motifs, (b) chromatin-IP, (c) functional enrichment, (d) under/overexpression, (e) TRANSFAC; windows of size 100 were used to construct the figures, see Materials and methods) as a function of the conservation score rank, obtained when applying FastCompare to S. cerevisiae and S. bayanus. (a-e) strongly indicate that the frequency of support increases with conservation score as calculated by FastCompare.
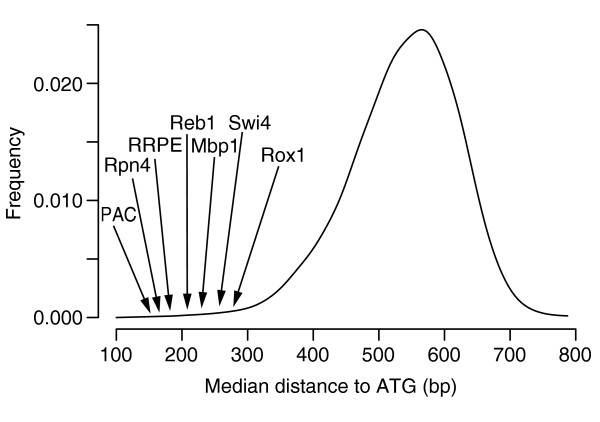
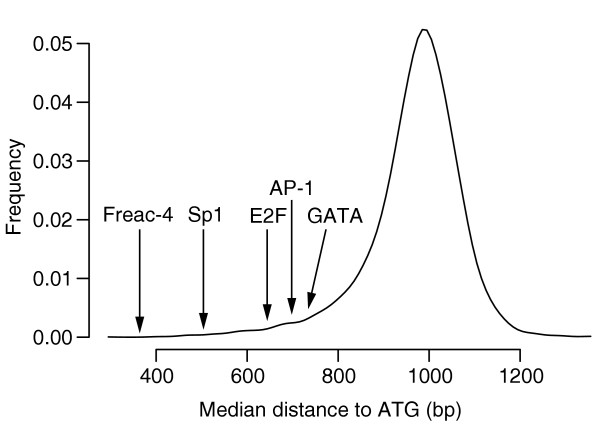
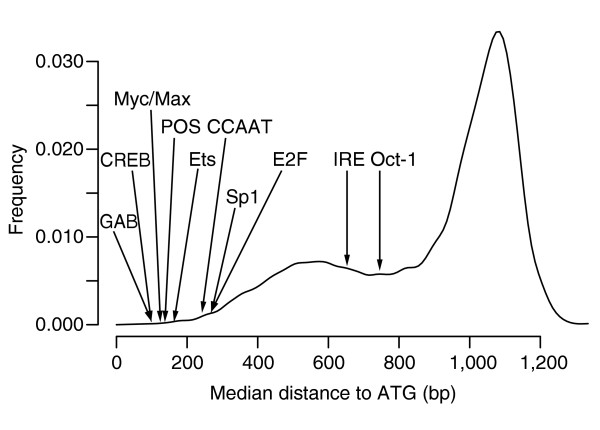
Distribution of median distances to ATG of all 7-mers, obtained when applying FastCompare to S. cerevisiae and S. bayanus. For each 7-mer, a median distance to ATG was calculated using the positions of matches upstream of S. cerevisiae genes within the conserved set for this 7-mer. The 8,170 median distances were then binned into 20-bp bins, and the resulting histogram was smoothed using a normal kernel. The median distances for several known binding sites in S. cerevisiae are also indicated (see Table 1).
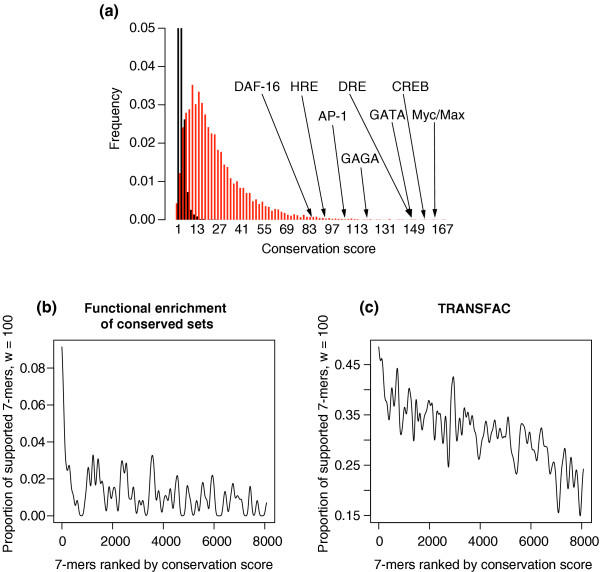
Validation of the conservation scores obtained when applying FastCompare to C. elegans and C. briggsae. (a) Distributions of conservation scores for actual (red) and randomized (black) data, showing that high conservation scores are unlikely to be obtained by chance. Conservation scores for some known regulatory elements are also indicated. Both distributions were constructed using bin sizes of 5, and the top portion of the figure is not shown for the purpose of presentation. (b-d) Proportion of 7-mers supported by different types of independent biological data (using windows of size 100, see Materials and methods) as a function of the conservation score rank, obtained when applying FastCompare to C. elegans and C. briggsae. (b-d) indicate that the frequency of support increases with conservation score as calculated by FastCompare.
Distribution of median distances to ATG of all 7-mers, obtained when applying FastCompare to C. elegans and C. briggsae. For each 7-mer, a median distance to ATG was calculated using the positions of matches upstream of C. elegans genes within the conserved set for this 7-mer. The 8,170 median distances were then binned into 20-bp bins, and the resulting histogram was smoothed using a normal kernel. The median distances for several known binding sites in C. elegans are also indicated.
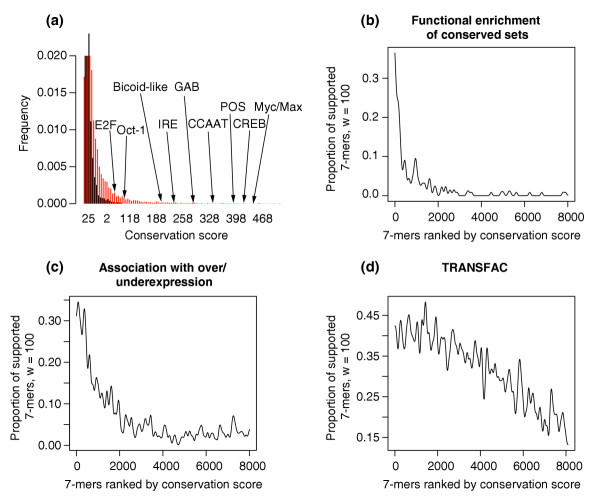
Validation of the conservation scores obtained when applying FastCompare to D. melanogaster and D. pseudoobscura. (a) Distributions of conservation scores for actual (red) and randomized (black) data, showing that high conservation scores are unlikely to be obtained from randomized data. Conservation scores for certain known regulatory elements are also indicated. Both distributions were constructed using bin sizes of 5, and the top portion of the figure is not shown for the purpose of presentation. (b, c) Proportion of 7-mers supported by different types of independent biological data (using windows of size 100, see Materials and methods) as a function of the conservation score rank, obtained when applying FastCompare to D. melanogaster and D. pseudoobscura. (b, c) strongly indicate that the frequency of support increases with conservation score as calculated by FastCompare.
Validation of the conservation scores obtained when applying FastCompare to H. sapiens and M. musculus. (a) Distributions of conservation scores for actual and randomized data, showing that high conservation scores are unlikely to be obtained by chance. Conservation scores for some known regulatory elements are also indicated. Both distributions were constructed using bin sizes of 5, and the top portion of the figure is not shown for the purpose of presentation. (b-d) Proportion of 7-mers supported by different types of independent biological data (using windows of size 100, see Materials and methods) as a function of the conservation score rank, obtained when applying FastCompare to H. sapiens and M. musculus. (b-d) strongly indicate that the frequency of support increases with conservation score as calculated by FastCompare.
Distribution of median distances to ATG of all 7-mers, obtained when applying FastCompare to H. sapiens and M. musculus. For each 7-mer, a median distance to ATG was calculated using the positions of matches upstream of H. sapiens genes within the conserved set for this 7-mer. The 8,170 median distances were then binned into 20-bp bins, and the resulting histogram was smoothed using a normal kernel. The median distances for several known binding sites in H. sapiens are also indicated.
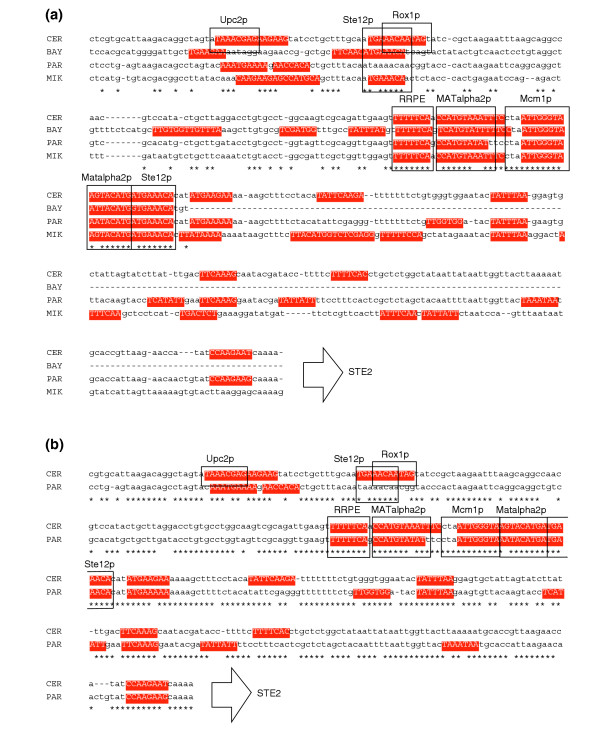
Partial representation (most proximal region) of the aligned 1 kb upstream regions of the S. cerevisiae STE12 gene and its orthologs. (a) The highest scoring 7-mers found by FastCompare in a comparison between S. cerevisiae and S. bayanus are highlighted. FastCompare correctly predicts the conserved and experimentally verified binding sites for Mcm1, Matalpha2 and Ste12 (proximal) (see [8] for review). A more distal non-verified binding site for Ste12, and a RRPE site close to the distal Matalpha2 are conserved between the four species, and also predicted by FastCompare. FastCompare predicts several nonconserved sites in each species. For example, in S. cerevisiae, it identifies a Rox1-binding site overlapping with the second Ste12 site, and a putative Upc2-binding site. (b) Aligned 1 kb upstream region of the S. cerevisiae STE2 gene and its S. paradoxus ortholog only, with the same highlighted 7-mers as in (a). Since the two yeast species diverged very recently, the two upstream regions appear highly conserved. However, using the FastCompare output allows efficient selection of verified and putative binding sites. CER, S. cerevisiae; Bay, S. bayanus; Par, S. paradoxus; Mik, S. mikatae.
Similar articles
-
Evolutionarily conserved elements in vertebrate, insect, worm, and yeast genomes.Genome Res. 2005 Aug;15(8):1034-50. doi: 10.1101/gr.3715005. Epub 2005 Jul 15. Genome Res. 2005. PMID: 16024819 Free PMC article.
-
Eukaryotic regulatory element conservation analysis and identification using comparative genomics.Genome Res. 2004 Mar;14(3):451-8. doi: 10.1101/gr.1327604. Genome Res. 2004. PMID: 14993210 Free PMC article.
-
Discovery of regulatory elements in vertebrates through comparative genomics.Nat Biotechnol. 2005 Oct;23(10):1249-56. doi: 10.1038/nbt1140. Nat Biotechnol. 2005. PMID: 16211068
-
Comparative genomics using fugu: a tool for the identification of conserved vertebrate cis-regulatory elements.Bioessays. 2005 Jan;27(1):100-7. doi: 10.1002/bies.20134. Bioessays. 2005. PMID: 15612032 Review.
-
Annotating non-coding regions of the genome.Nat Rev Genet. 2010 Aug;11(8):559-71. doi: 10.1038/nrg2814. Epub 2010 Jul 13. Nat Rev Genet. 2010. PMID: 20628352 Review.
Cited by
-
Identification of candidate regulatory sequences in mammalian 3' UTRs by statistical analysis of oligonucleotide distributions.BMC Bioinformatics. 2007 May 24;8:174. doi: 10.1186/1471-2105-8-174. BMC Bioinformatics. 2007. PMID: 17524134 Free PMC article.
-
Practical strategies for discovering regulatory DNA sequence motifs.PLoS Comput Biol. 2006 Apr;2(4):e36. doi: 10.1371/journal.pcbi.0020036. PLoS Comput Biol. 2006. PMID: 16683017 Free PMC article. No abstract available.
-
Systematic discovery of regulatory motifs in Fusarium graminearum by comparing four Fusarium genomes.BMC Genomics. 2010 Mar 26;11:208. doi: 10.1186/1471-2164-11-208. BMC Genomics. 2010. PMID: 20346147 Free PMC article.
-
H2A.Z-Mediated Genome-Wide Chromatin Specialization.Curr Genomics. 2007 Mar;8(1):59-66. doi: 10.2174/138920207780076965. Curr Genomics. 2007. PMID: 18645626 Free PMC article.
-
Revealing global regulatory perturbations across human cancers.Mol Cell. 2009 Dec 11;36(5):900-11. doi: 10.1016/j.molcel.2009.11.016. Mol Cell. 2009. PMID: 20005852 Free PMC article.
References
Publication types
MeSH terms
Grants and funding
LinkOut - more resources
Full Text Sources
Molecular Biology Databases
