

doi: 10.1186/gb-2005-6-2-r20.
Epub 2005 Feb 1.
Genomic analysis of early murine mammary gland development using novel probe-level algorithms
Affiliations
- PMID: 15693949
- PMCID: PMC551540
- DOI: 10.1186/gb-2005-6-2-r20
Item in Clipboard
Genomic analysis of early murine mammary gland development using novel probe-level algorithms
Genome Biol.
2005.
Abstract
We describe a novel algorithm (ChipStat) for detecting gene-expression changes utilizing probe-level comparisons of replicate Affymetrix oligonucleotide microarray data. A combined detection approach is shown to yield greater sensitivity than a number of widely used methodologies including SAM, dChip and logit-T. Using this approach, we identify alterations in functional pathways during murine neonatal-pubertal mammary development that include the coordinate upregulation of major urinary proteins and the downregulation of loci exhibiting reciprocal imprinting.
Figures
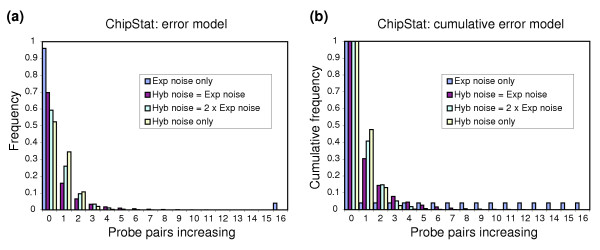
ChipStat behavior using simulated biological/experimental + hybridization noise model. The behavior of the ChipStat algorithm was evaluated (pps = 0.05, 16 probe pairs per probe set) using a Monte Carlo model in which the ratio of biological + experimental noise (E(b) + E(p)) to hybridization noise (E(h)) is constant (see text for further details). Results are shown for E(h) = 0 (Exp noise only; blue), E(h) = E(b) + E(p) (Hyb noise = Exp noise; red), E(h) = 2 × (E(b) + E(p)) (Hyb noise = 2 × Exp noise; green), and E(b) + E(p) = 0 (Hyb noise only; yellow). The total number of probe sets simulated (11,820) was chosen to match the number of probe sets containing 16 probe pairs per probe set on the Affymetrix MG_U74Av2 array. The number of probe pairs increasing by chance is shown on the x axis, and the fraction of total probe sets simulated is shown on the y axis. This simulation was repeated 100×, and the average of these results is shown. (a) Probability of the indicated number of probe pairs increasing. (b) Cumulative P value (equal to or greater than the indicated number of probe pairs changing).
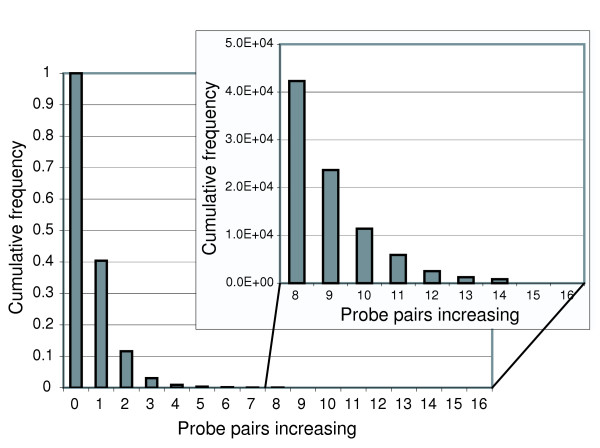
Empirical measurement of the ChipStat null distribution. Mammary gland tissue was harvested from six separate, biologically identical pools of FVB (MTB) mice, and hybridization data to Affymetrix MG_U74Av2 microarrays was obtained. Comparisons of all possible three versus three combinations (total 20) were performed using ChipStat (pps = 0.05), and the number of significant increases was tabulated for all probe sets containing 16 probe pairs per probe set (total = 11,820). The cumulative average probability is shown as a function of the number of probe pairs that increase within the probe set.
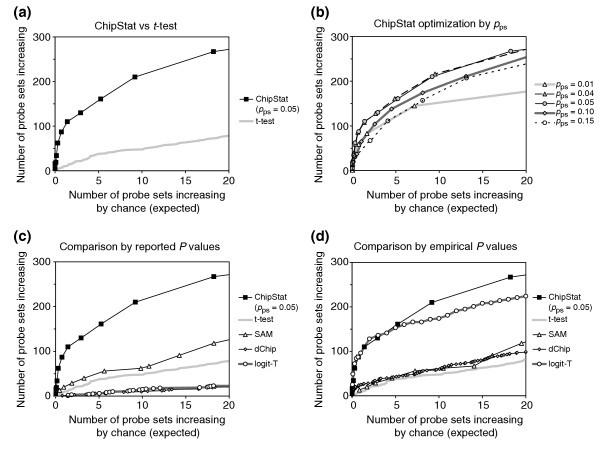
Relative detection sensitivity of differential gene expression. The number of probe sets shown to increase from 2 to 5 weeks of murine mammary gland development was tabulated as a function of the number of probe sets expected to increase by chance. (a) ChipStat (pps = 0.05), vs t-test. (b) Optimization of ChipStat sensitivity as a function of pps. (c) ChipStat vs other techniques: reported P values. For ChipStat, the number of probe sets expected to increase by chance was empirically estimated from negative control data. For the t-test, SAM, dChip and logit-T, reported P values from the 2-week vs 5-week mammary gland comparison were used. (d) ChipStat vs other techniques: empirical P values. The number of probe sets expected to increase by chance was empirically estimated for ChipStat, t-test, SAM, dChip and logit-T (representative points).
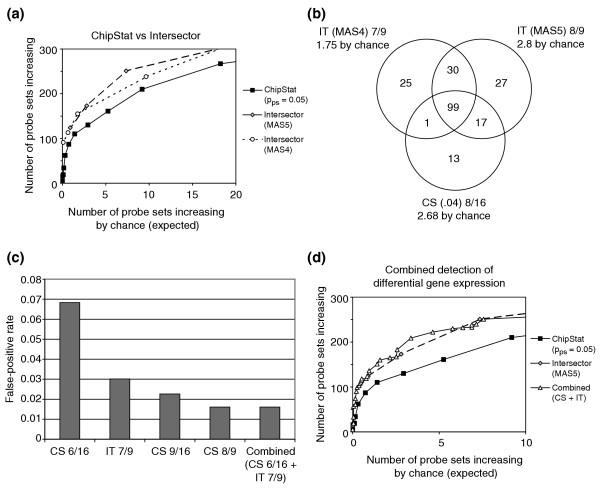
Intersector and ChipStat performance. (a) The number of probe sets shown to increase from 2 to 5 weeks of murine mammary gland development was tabulated as a function of the number of probe sets expected to increase by chance, and a comparison of ChipStat (pps = 0.05), Intersector (MAS 5.0 change calls), and Intersector (MAS 4.0 change calls) is shown. (b) Venn diagram showing distinct probe sets identified by ChipStat and Intersector. The number of genes shown to be differentially expressed at the indicated expected false-positive levels is shown for ChipStat (CS) (pps = 0.04), Intersector (IT) with MAS 5.0 calls, and Intersector (IT) with MAS 4.0 calls. (c) False-positive rates for ChipStat (CS 6/16: pps = 0.05, 6/16 probe pairs increasing; CS 9/16: pps = 0.05, 9/16 probe pairs increasing), Intersector (MAS5) (IT 7/9: 7/9 increases or marginal increases; IT 8/9: 8/9 increases or marginal increases), or ChipStat and Intersector together (Combined: intersection of CS 6/16 and IT 7/9) are shown. (d) Combined performance of ChipStat and Intersector. Increases from 2 to 5 weeks of mammary gland development are shown for ChipStat alone (pps = 0.05), Intersector alone (MAS 5.0), and optimized intersections of ChipStat and Intersector (see Additional data file 1).
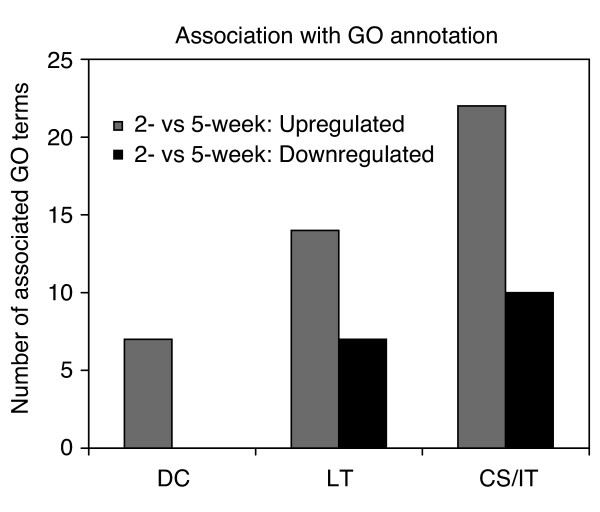
Quantitative association with GO categories. The number of GO terms found to be statistically associated (P < 0.05 using within-system bootstrap to account for multiple testing) with lists of differentially regulated genes (2 vs 5 weeks of murine mammary gland development) is shown. Lists of up- and downregulated genes were generated using dChip (DC), logit-T (LT) and a ChipStat/Intersector hybrid (CS/IT) that were matched in stringency to give equivalent numbers of expected false-positive genes.
Similar articles
-
Identification of differentially expressed microRNAs during the development of Chinese murine mammary gland.J Genet Genomics. 2007 Nov;34(11):966-73. doi: 10.1016/S1673-8527(07)60109-X. J Genet Genomics. 2007. PMID: 18037133
-
A high performance test of differential gene expression for oligonucleotide arrays.Genome Biol. 2003;4(10):R67. doi: 10.1186/gb-2003-4-10-r67. Epub 2003 Sep 10. Genome Biol. 2003. PMID: 14519202 Free PMC article.
-
Computational expression deconvolution in a complex mammalian organ.BMC Bioinformatics. 2006 Jul 3;7:328. doi: 10.1186/1471-2105-7-328. BMC Bioinformatics. 2006. PMID: 16817968 Free PMC article.
-
Genomic profiling: cDNA arrays and oligoarrays.Methods Mol Biol. 2012;823:89-105. doi: 10.1007/978-1-60327-216-2_7. Methods Mol Biol. 2012. PMID: 22081341 Review.
-
[Functional genomics analysis on DNA microarray].Tanpakushitsu Kakusan Koso. 2004 Aug;49(11 Suppl):1853-8. Tanpakushitsu Kakusan Koso. 2004. PMID: 15377028 Review. Japanese. No abstract available.
Cited by
-
Genes involved in post-transcriptional regulation are overrepresented in stem/progenitor spermatogonia of cryptorchid mouse testes.Stem Cells. 2008 Apr;26(4):927-38. doi: 10.1634/stemcells.2007-0893. Epub 2008 Jan 17. Stem Cells. 2008. PMID: 18203673 Free PMC article.
-
The epigenetic landscape of mammary gland development and functional differentiation.J Mammary Gland Biol Neoplasia. 2010 Mar;15(1):85-100. doi: 10.1007/s10911-010-9170-4. Epub 2010 Feb 17. J Mammary Gland Biol Neoplasia. 2010. PMID: 20157770 Free PMC article. Review.
-
Effect of PITX2 knockdown on transcriptome of primary human trabecular meshwork cell cultures.Mol Vis. 2011;17:1209-21. Epub 2011 May 5. Mol Vis. 2011. PMID: 21617755 Free PMC article.
-
Profile of estrogen-responsive genes in an estrogen-specific mammary gland outgrowth model.Mol Reprod Dev. 2009 Aug;76(8):733-50. doi: 10.1002/mrd.21041. Mol Reprod Dev. 2009. PMID: 19484750 Free PMC article.
-
A hormonal cue promotes timely follicle cell migration by modulating transcription profiles.Mech Dev. 2017 Dec;148:56-68. doi: 10.1016/j.mod.2017.06.003. Epub 2017 Jun 10. Mech Dev. 2017. PMID: 28610887 Free PMC article.
References
-
- Coller HA, Grandori C, Tamayo P, Colbert T, Lander ES, Eisenman RN, Golub TR. Expression analysis with oligonucleotide microarrays reveals that MYC regulates genes involved in growth, cell cycle, signaling, and adhesion. Proc Natl Acad Sci USA. 2000;97:3260–3265. doi: 10.1073/pnas.97.7.3260. - DOI - PMC - PubMed
-
- Schena M, Shalon D, Davis RW, Brown PO. Quantitative monitoring of gene expression patterns with a complementary DNA microarray. Science. 1995;270:467–470. - PubMed
Publication types
MeSH terms
Substances
Grants and funding
LinkOut - more resources
Full Text Sources
Other Literature Sources
