

Transient attention enhances perceptual performance and FMRI response in human visual cortex
- PMID: 15694332
- PMCID: PMC3825510
- DOI: 10.1016/j.neuron.2004.12.039
Transient attention enhances perceptual performance and FMRI response in human visual cortex
Abstract
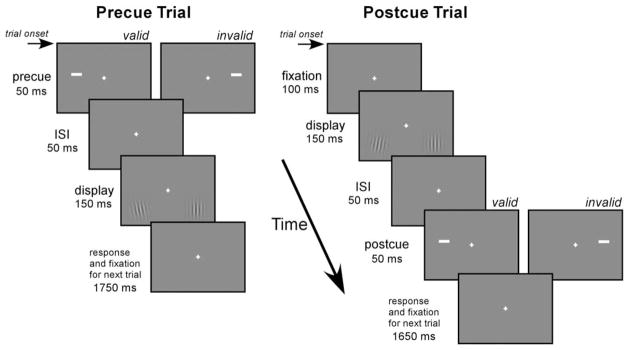
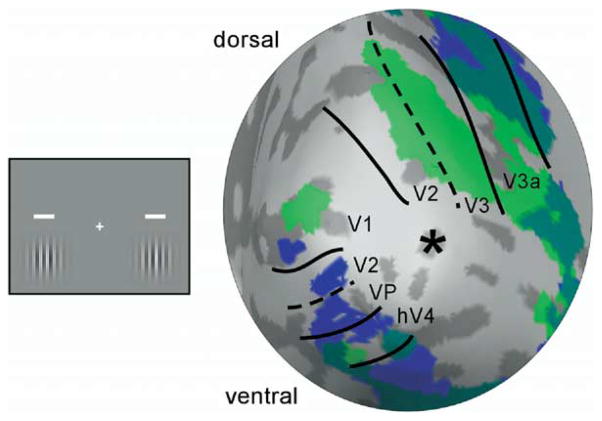
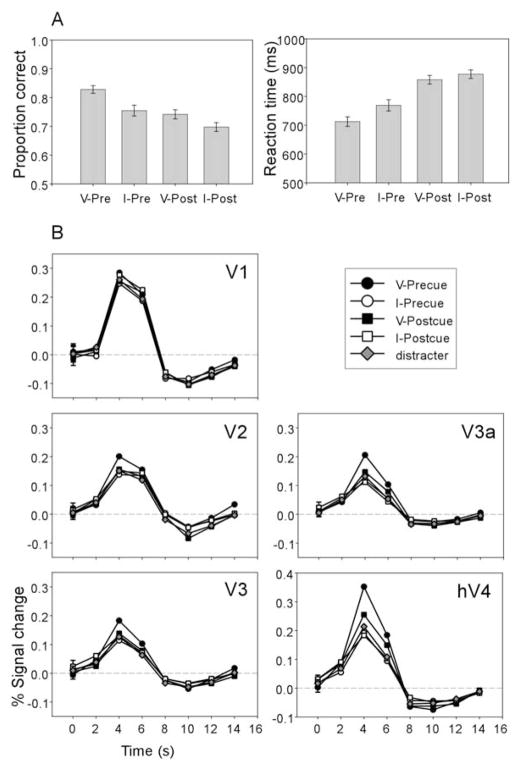
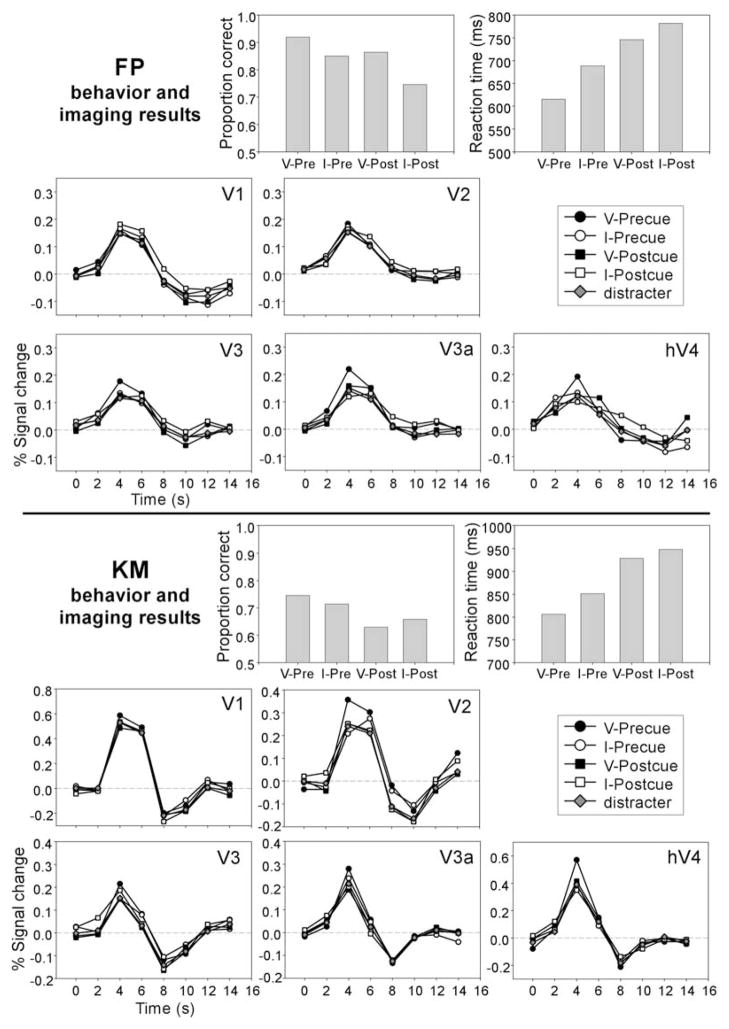
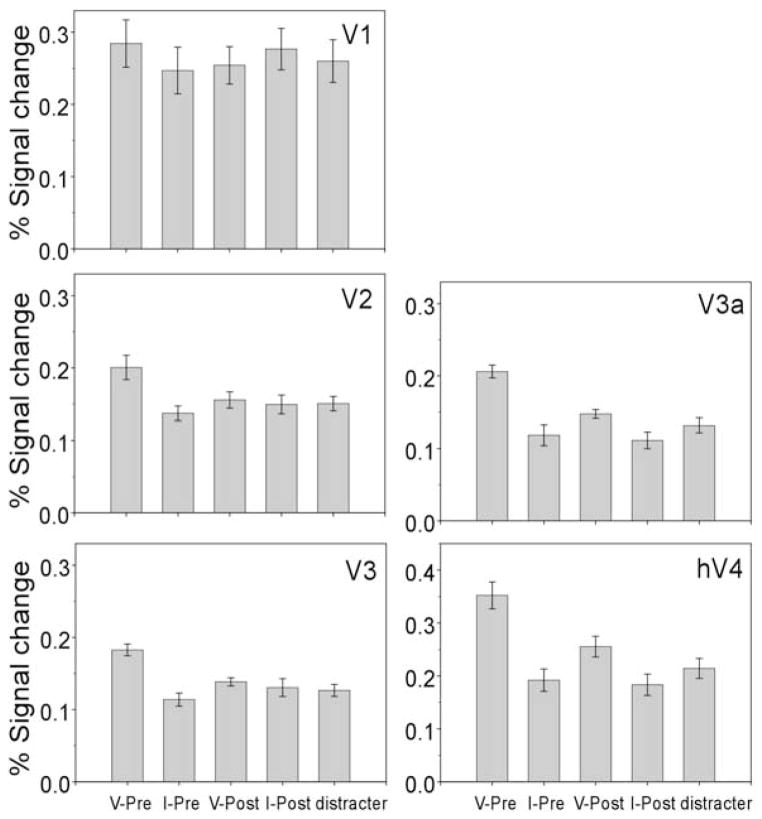
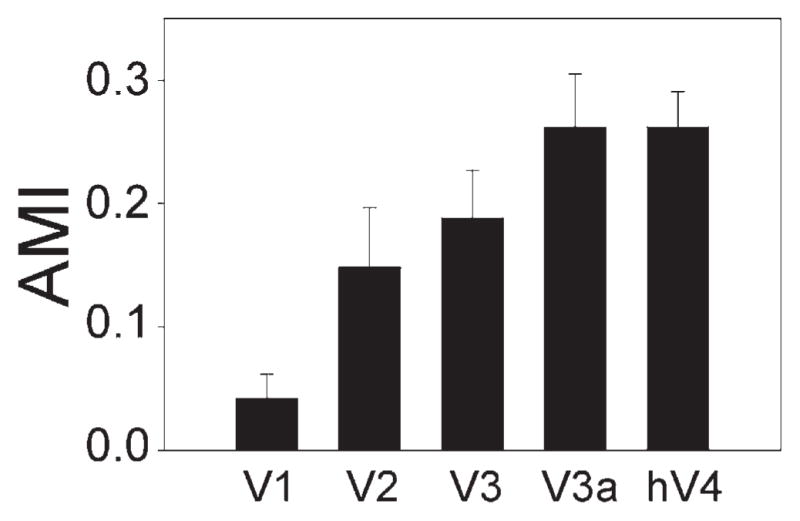
When a visual stimulus suddenly appears, it captures attention, producing a transient improvement of performance on basic visual tasks. We investigate the effect of transient attention on stimulus representations in early visual areas using rapid event-related fMRI. Participants discriminated the orientation of one of two gratings preceded or followed by a nonpredictive peripheral cue. Compared to control conditions, precueing the target location improved performance and produced a larger fMRI response in corresponding retinotopic areas. This enhancement progressively increased from striate to extrastriate areas. Control conditions indicated that the enhanced fMRI response was not due to sensory summation of cue and target signals. Thus, an uninformative precue increases both perceptual performance and the concomitant stimulus-evoked activity in early visual areas. These results provide evidence regarding the retinotopically specific neural correlate for the effects of transient attention on early vision.
Figures
Similar articles
-
Delayed striate cortical activation during spatial attention.Neuron. 2002 Aug 1;35(3):575-87. doi: 10.1016/s0896-6273(02)00781-x. Neuron. 2002. PMID: 12165478
-
Involvement of striate and extrastriate visual cortical areas in spatial attention.Nat Neurosci. 1999 Apr;2(4):364-9. doi: 10.1038/7274. Nat Neurosci. 1999. PMID: 10204544
-
Multiple spotlights of attentional selection in human visual cortex.Neuron. 2004 May 27;42(4):677-86. doi: 10.1016/s0896-6273(04)00263-6. Neuron. 2004. PMID: 15157427
-
Splitting the spotlight of visual attention.Neuron. 2004 May 27;42(4):524-6. doi: 10.1016/j.neuron.2004.05.005. Neuron. 2004. PMID: 15157414 Review.
-
Dynamics of emotional effects on spatial attention in the human visual cortex.Prog Brain Res. 2006;156:67-91. doi: 10.1016/S0079-6123(06)56004-2. Prog Brain Res. 2006. PMID: 17015075 Review.
Cited by
-
Modulations of emotional attention and spatial attention on human visual cortical activities.Psychol Res Behav Manag. 2019 May 17;12:375-384. doi: 10.2147/PRBM.S188121. eCollection 2019. Psychol Res Behav Manag. 2019. PMID: 31191058 Free PMC article.
-
Sustained Auditory Attentional Load Decreases Audiovisual Integration in Older and Younger Adults.Neural Plast. 2021 Jun 17;2021:4516133. doi: 10.1155/2021/4516133. eCollection 2021. Neural Plast. 2021. Retraction in: Neural Plast. 2023 Aug 30;2023:9795436. doi: 10.1155/2023/9795436. PMID: 34221001 Free PMC article. Retracted.
-
Interoceptive Awareness of the Breath Preserves Attention and Language Networks amidst Widespread Cortical Deactivation: A Within-Participant Neuroimaging Study.eNeuro. 2023 Jun 26;10(6):ENEURO.0088-23.2023. doi: 10.1523/ENEURO.0088-23.2023. Print 2023 Jun. eNeuro. 2023. PMID: 37316296 Free PMC article. Clinical Trial.
-
Exogenous attention generalizes location transfer of perceptual learning in adults with amblyopia.iScience. 2022 Feb 2;25(3):103839. doi: 10.1016/j.isci.2022.103839. eCollection 2022 Mar 18. iScience. 2022. PMID: 35243224 Free PMC article.
-
Color vision in ADHD: part 2--does attention influence color perception?Behav Brain Funct. 2014 Oct 24;10:39. doi: 10.1186/1744-9081-10-39. Behav Brain Funct. 2014. PMID: 25344205 Free PMC article.
References
-
- Boynton GM, Demb JB, Glover GH, Heeger DJ. Neuronal basis of contrast discrimination. Vision Res. 1999;39:257–269. - PubMed
-
- Brainard DH. The psychophysics toolbox. Spat Vis. 1997;10:433–436. - PubMed
-
- Brefczynski JA, DeYoe EA. A physiological correlate of the ‘spotlight’ of visual attention. Nat Neurosci. 1999;2:370–374. - PubMed
-
- Cameron EL, Tai JC, Carrasco M. Covert attention affects the psychometric function of contrast sensitivity. Vision Res. 2002;42:949–967. - PubMed
Publication types
MeSH terms
Grants and funding
LinkOut - more resources
Full Text Sources
