

Voluntarily controlled bi-stable slant perception of real and photographed surfaces
- PMID: 15695204
- PMCID: PMC1634956
- DOI: 10.1098/rspb.2004.2896
Voluntarily controlled bi-stable slant perception of real and photographed surfaces
Abstract
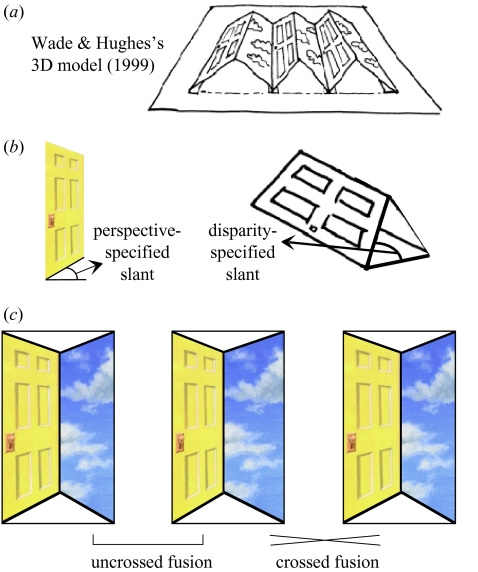
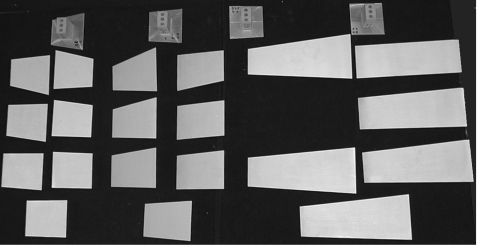
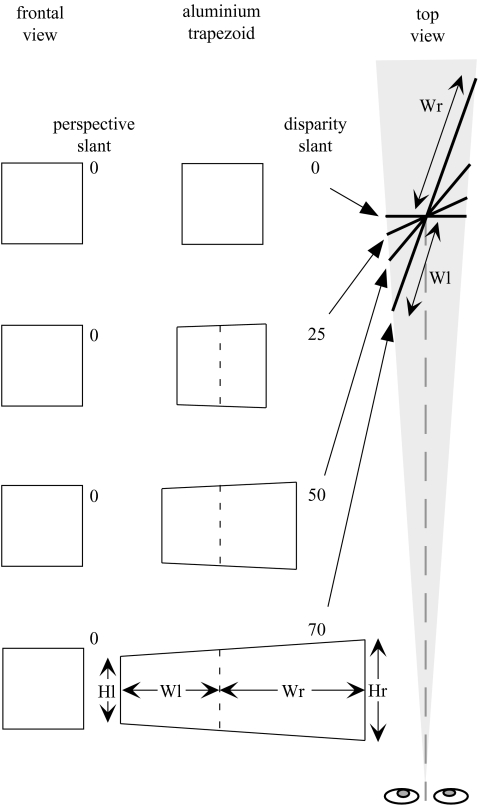
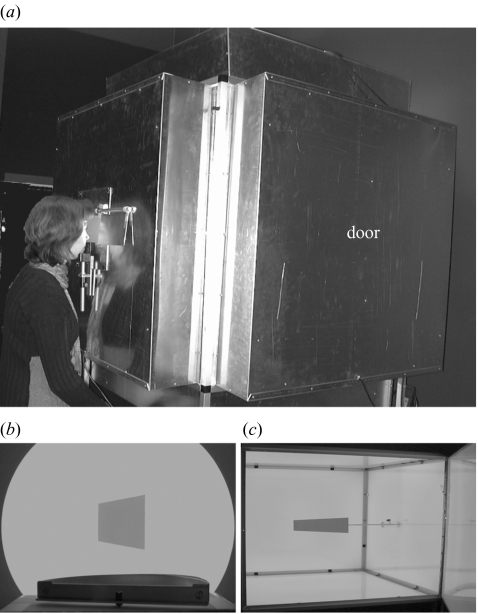
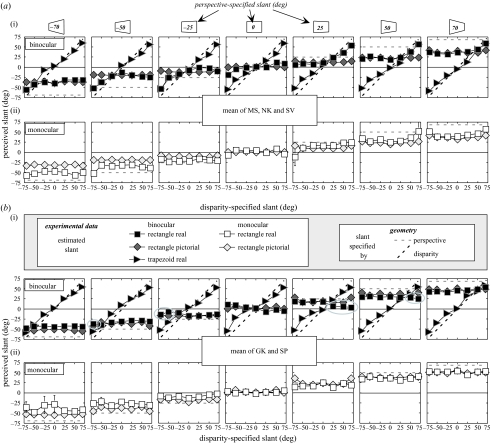
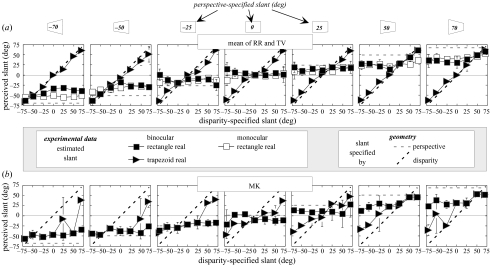
We have quantified voluntarily selected perceived slant of real trapezoidal surfaces (a 'reverse-perspective' scene) and their photographed counterparts (pictorial space). The surfaces were slanted about the vertical axis and observers estimated slant relative to the frontal plane. We were particularly interested in those cases in which binocular disparity and monocular perspective provided conflicting slant information. We varied the monocularly and binocularly specified surface slants independently across stimulus presentations. To eliminate texture and shading cues we used sand-blasted aluminium trapezoidal surfaces illuminated from all directions. When disparity-specified slant and perspective-specified slant were conflicting, observers were able to perceive the surfaces in two ways: they perceived either a trapezoid or a rectangle. Our main finding is twofold. First, when subjects chose to perceive the trapezoid, the slant estimates followed the disparity-predicted slant with only a slight underestimation, as if they selected a pure binocular representation of slant governed only by disparity. Second, when subjects chose to perceive the rectangle their estimates for real surfaces were similar to those for photographed surfaces, as if they selected a representation of slant governed by perspective foreshortening.
Figures
Similar articles
-
Bi-stability in perceived slant when binocular disparity and monocular perspective specify different slants.J Vis. 2002;2(9):597-607. doi: 10.1167/2.9.2. J Vis. 2002. PMID: 12678631
-
Monocular and binocular edges enhance the perception of stereoscopic slant.Vision Res. 2014 Jul;100:113-23. doi: 10.1016/j.visres.2014.04.012. Epub 2014 May 5. Vision Res. 2014. PMID: 24802594
-
The role of (micro)saccades and blinks in perceptual bi-stability from slant rivalry.Vision Res. 2005 Aug;45(18):2417-35. doi: 10.1016/j.visres.2005.03.013. Vision Res. 2005. PMID: 15894347
-
Slant perception, and its voluntary control, do not govern the slant aftereffect: multiple slant signals adapt independently.Vision Res. 2006 Oct;46(20):3381-92. doi: 10.1016/j.visres.2006.03.027. Epub 2006 May 15. Vision Res. 2006. PMID: 16698056
-
The effect of surface placement and surface overlap on stereo slant contrast and enhancement.Vision Res. 2005 Nov;45(25-26):3083-95. doi: 10.1016/j.visres.2005.07.003. Epub 2005 Aug 19. Vision Res. 2005. PMID: 16112705
Cited by
-
Depth cues, rather than perceived depth, govern vergence.Exp Brain Res. 2008 Jan;184(1):61-70. doi: 10.1007/s00221-007-1081-2. Epub 2007 Aug 24. Exp Brain Res. 2008. PMID: 17717656 Free PMC article.
References
-
- Ames A. Visual perception and the rotating trapezoidal window. Psychol. Monogr. Gen. Appl. 1951;65:1–31.
-
- Blake R., Logothetis N.K. Visual competition. Nature Rev. Neurosci. 2002;3:1–11. - PubMed
-
- Clark W.C., Smith A.H., Rabe A. The interaction of surface texture, outline gradient, and ground in the perception of slant. Can. J. Psychol. 1956;10:1–8. - PubMed
-
- Cook N.D., Hayashi T., Amemiya T., Suzuki K., Leumann L. Effects of visual-field inversions on the reverse-perspective illusion. Perception. 2002;31:1147–1151. - PubMed
-
- Ellis S.R., Kaiser M.K., Grunwald A.C., editors. Pictorial communication in virtual and real environments. Taylor & Francis; London: 1991.
Publication types
MeSH terms
LinkOut - more resources
Full Text Sources
