

Predator-induced synchrony in population oscillations of coexisting small mammal species
- PMID: 15695211
- PMCID: PMC1634955
- DOI: 10.1098/rspb.2004.2860
Predator-induced synchrony in population oscillations of coexisting small mammal species
Abstract
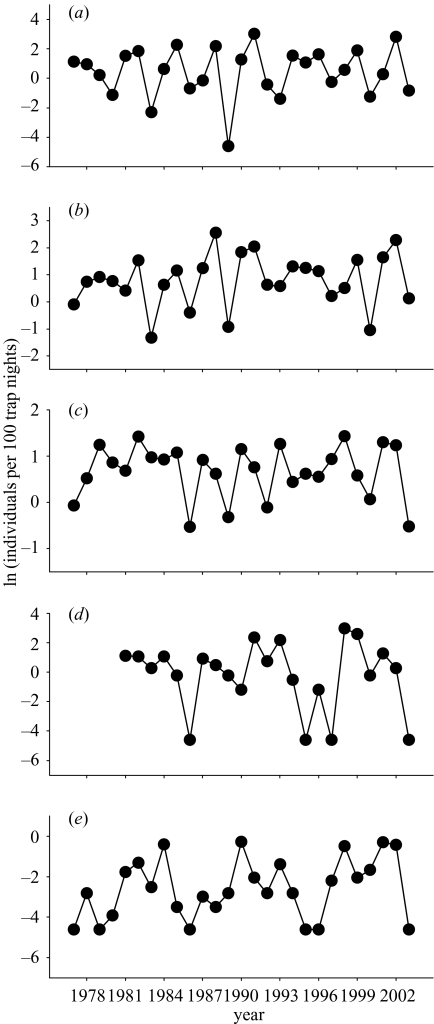
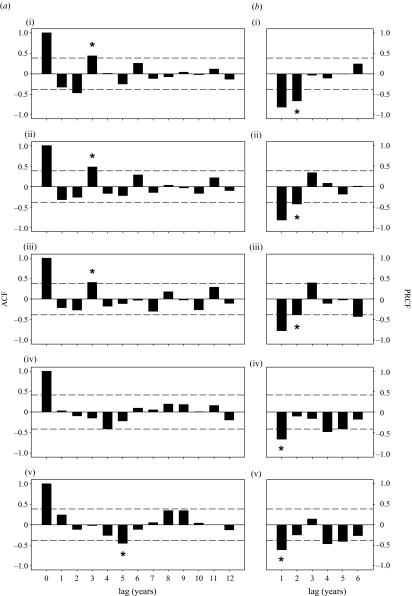
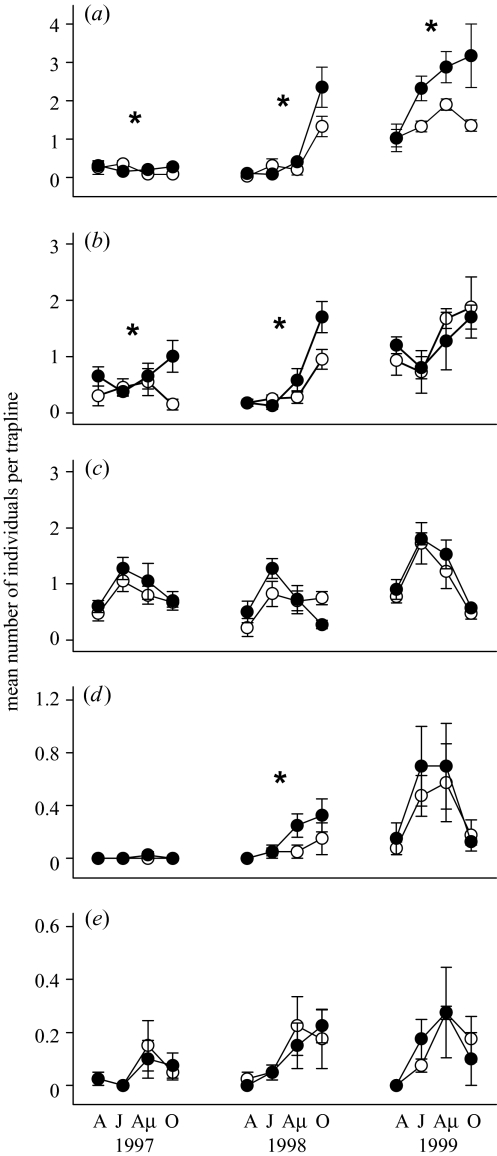
Comprehensive analyses of long-term (1977-2003) small-mammal abundance data from western Finland showed that populations of Microtus voles (field voles M. agrestis and sibling voles M. rossiaemeridionalis) voles, bank (Clethrionomys glareolus) and common shrews (Sorex araneus) fluctuated synchronously in 3 year population cycles. Time-series analyses indicated that interspecific synchrony is influenced strongly by density-dependent processes. Synchrony among Microtus and bank voles appeared additionally to be influenced by density-independent processes. To test whether interspecific synchronization through density-dependent processes is caused by predation, we experimentally reduced the densities of the main predators of small mammals in four large agricultural areas, and compared small mammal abundances in these to those in four control areas (2.5-3 km(2)) through a 3 year small-mammal population cycle. Predator reduction increased densities of the main prey species, Microtus voles, in all phases of the population cycle, while bank voles, the most important alternative prey of predators, responded positively only in the low and the increase phase. Manipulation also increased the autumn densities of water voles (Arvicola terrestris) in the increase phase of the cycle. No treatment effects were detected for common shrews or mice. Our results are in accordance with the alternative prey hypothesis, by which predators successively reduce the densities of both main and alternative prey species after the peak phase of small-mammal population cycles, thus inducing a synchronous low phase.
Figures
Similar articles
-
Spatio-temporal patterns of habitat use in voles and shrews modified by density, season and predators.J Anim Ecol. 2012 Jul;81(4):747-55. doi: 10.1111/j.1365-2656.2012.01956.x. Epub 2012 Feb 10. J Anim Ecol. 2012. PMID: 22325037
-
Numerical response of a mammalian specialist predator to multiple prey dynamics in Mediterranean farmlands.Ecology. 2019 Sep;100(9):e02776. doi: 10.1002/ecy.2776. Epub 2019 Aug 20. Ecology. 2019. PMID: 31172505
-
Changes in individual quality during a 3-year population cycle of voles.Oecologia. 2002 Jan;130(2):239-249. doi: 10.1007/s004420100795. Epub 2002 Jan 1. Oecologia. 2002. PMID: 28547147
-
Insights From Observations and Large-Scale Field Experiments on Vole Population Cycles in Northern Europe: A 40-Year Study of Predator-Prey Interactions.Ecol Evol. 2025 May 8;15(5):e71419. doi: 10.1002/ece3.71419. eCollection 2025 May. Ecol Evol. 2025. PMID: 40342711 Free PMC article. Review.
-
Population cycles in northern small mammals.Biol Rev Camb Philos Soc. 1995 Nov;70(4):621-37. doi: 10.1111/j.1469-185x.1995.tb01654.x. Biol Rev Camb Philos Soc. 1995. PMID: 8527608 Review.
Cited by
-
Hantavirus infections in fluctuating host populations: the role of maternal antibodies.Proc Biol Sci. 2010 Dec 22;277(1701):3783-91. doi: 10.1098/rspb.2010.1022. Epub 2010 Jun 30. Proc Biol Sci. 2010. PMID: 20591866 Free PMC article.
-
Predation risk in relation to brain size in alternative prey of pygmy owls varies depending on the abundance of main prey.PLoS One. 2020 Sep 11;15(9):e0236155. doi: 10.1371/journal.pone.0236155. eCollection 2020. PLoS One. 2020. PMID: 32915780 Free PMC article.
-
Guardian or threat: does golden eagle predation risk have cascading effects on forest grouse?Oecologia. 2016 Oct;182(2):487-98. doi: 10.1007/s00442-016-3680-8. Epub 2016 Jun 24. Oecologia. 2016. PMID: 27342659
-
Immigration ensures population survival in the Siberian flying squirrel.Ecol Evol. 2017 Feb 15;7(6):1858-1868. doi: 10.1002/ece3.2807. eCollection 2017 Mar. Ecol Evol. 2017. PMID: 28331593 Free PMC article.
-
Strong and lasting impacts of past global warming on baleen whales and their prey.Glob Chang Biol. 2022 Apr;28(8):2657-2677. doi: 10.1111/gcb.16085. Epub 2022 Feb 2. Glob Chang Biol. 2022. PMID: 35106859 Free PMC article.
References
-
- Angelstam P., Lindström E., Widén P. Role of predation in short-term population fluctuations of some birds and mammals in Fennoscandia. Oecologia. 1984;62:199–208. - PubMed
-
- Angelstam P., Lindström E., Widén P. Synchronous short-term population fluctuctions of some birds and mammals in Fennoscandia—occurrence and distribution. Holarct. Ecol. 1985;8:285–298.
-
- Berryman A.A., Turchin P. Identifying the density-dependent structure underlying ecological time series. Oikos. 2001;92:265–270.
-
- Boutin S. Population changes of the vertebrate community during a snowshoe hare cycle in Canada’s boreal forest. Oikos. 1995;74:69–80. (and 21 others)
-
- Chatfield C. The analysis of time series: an introduction. Chapman & Hall/CRC; London: 2003.
Publication types
MeSH terms
LinkOut - more resources
Full Text Sources
