Comparative Study
. 2005 Apr 1;564(Pt 1):173-87.
doi: 10.1113/jphysiol.2004.079160. Epub 2005 Feb 3.

Post-tetanic potentiation in the rat calyx of Held synapse

Affiliations
Comparative Study

Post-tetanic potentiation in the rat calyx of Held synapse

Ron L P Habets et al. J Physiol. .

Abstract

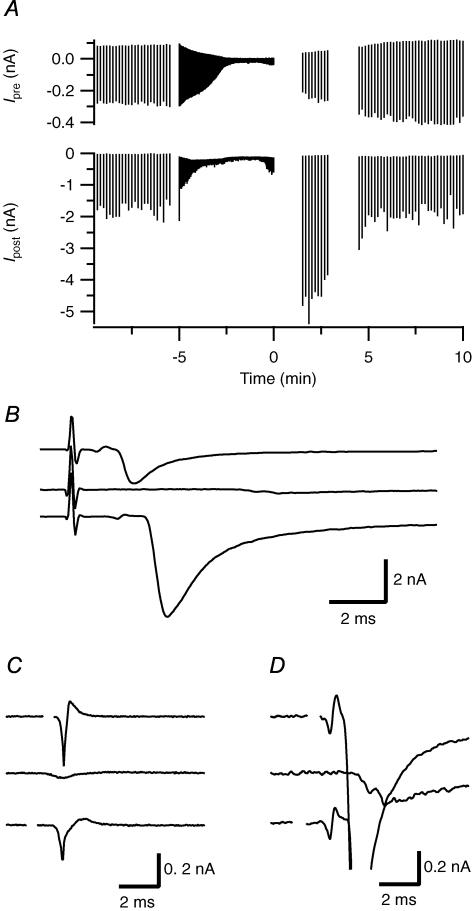
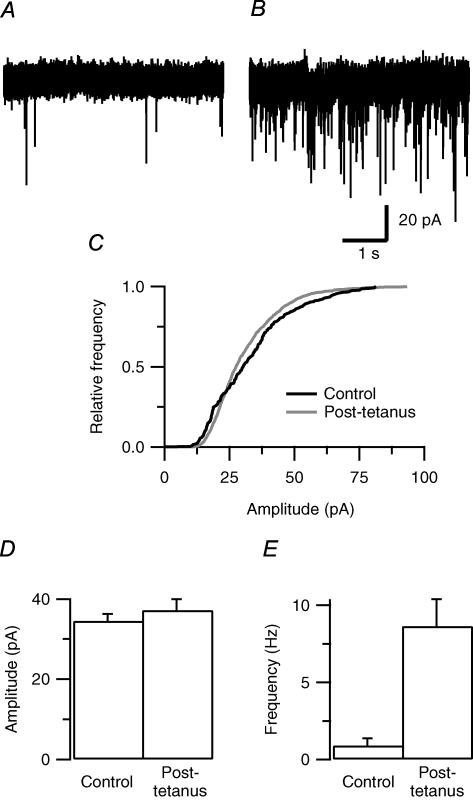
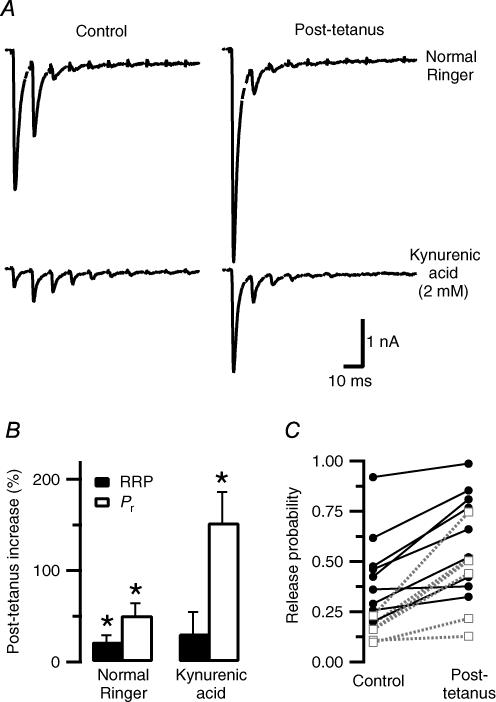
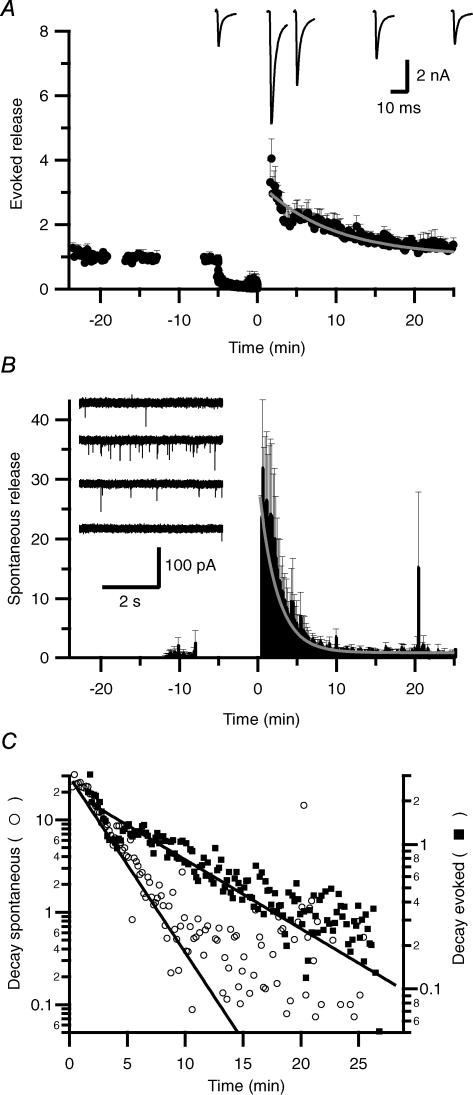
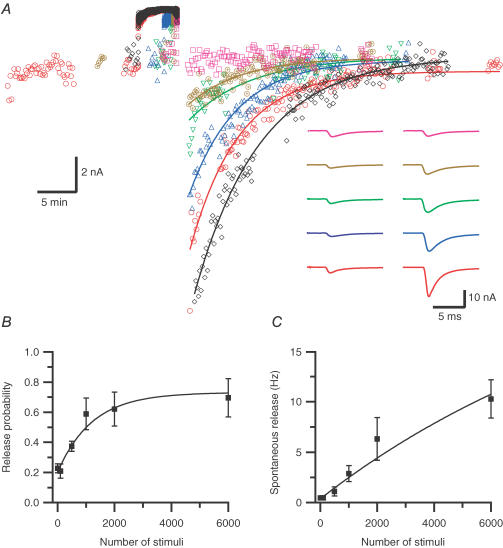
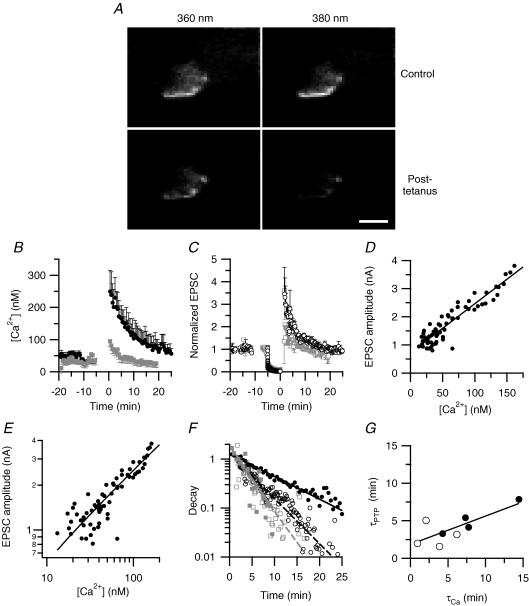
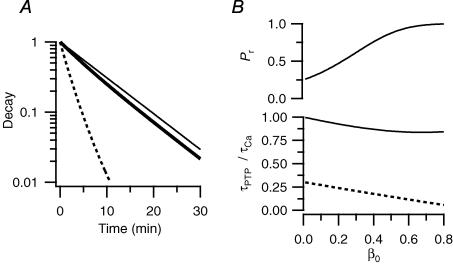
We studied synaptic plasticity in the calyx of Held synapse, an axosomatic synapse in the auditory brainstem, by making whole-cell patch clamp recordings of the principal cells innervated by the calyces in a slice preparation of 7- to 10-day-old rats. A 5 min 20 Hz stimulus train increased the amplitude of excitatory postsynaptic currents (EPSCs) on average more than twofold. The amplitude of the synaptic currents took several minutes to return to control values. The post-tetanic potentiation (PTP) was accompanied by a clear increase in the frequency, but not the amplitude, of spontaneous EPSCs, which returned to baseline more rapidly than the potentiation of evoked release. The size of the readily releasable pool of vesicles was increased by about 30%. In experiments in which presynaptic measurements of the intracellular calcium concentration were combined with postsynaptic voltage clamp recordings, PTP was accompanied by an increase in the presynaptic calcium concentration to about 210 nM. The decay of the PTP matched the decay of this increase. When the decay of the calcium transient was shortened by dialysing the terminal with EGTA, the PTP decay sped up in parallel. Our experiments suggest that PTP at the calyx of Held synapse is due to a long-lasting increase in the presynaptic calcium concentration following a tetanus, which results in an increase in the release probability of the vesicles of the readily releasable pool. Although part of the PTP can be explained by a direct activation of the calcium sensor for phasic release, other mechanisms are likely to contribute as well.


Figures

Figure 1
Figure 1. Post-tetanic potentiation at the calyx of Held synapse
Cells were stimulated by an electrode placed in the ventral midline of the slice. A baseline period of 0.1 Hz stimulation preceded a 20 Hz tetanus of 5 min. One to two minutes after the tetanus, EPSCs were again evoked at 0.1 Hz. Before and after the tetanus, stimulation was interrupted to measure spontaneous release. A: top traces, presynaptic recording in cell-attached configuration; bottom traces, EPSCs simultaneously recorded in postsynaptic whole-cell configuration. B, postsynaptic recording. Top trace, last EPSC of the baseline period. Middle trace, response to last stimulus of the 5 min 20 Hz tetanus. Bottom trace, first EPSC, evoked 1 min after the tetanus. C, presynaptic traces at the same time points as the signals shown in B, shown at high magnification to illustrate the changes in the cell-attached presynaptic action potential. D, enlargement of the prespikes preceding the EPSCs shown in B. Signals in C and D were aligned on the negative peak of the recorded presynaptic action potential. In A, C and D, stimulation artifacts were removed. In the postsynaptic recordings shown in A, prespikes were removed as well
Figure 2
Figure 2. Increase of spontaneous release after a 5 min 20 Hz tetanus
A, postsynaptic voltage clamp recording before the tetanus. B, increase in frequency of spontaneous EPSCs directly following the tetanus. C, cumulative amplitude distribution of the spontaneous EPSCs of the experiment illustrated in A and B. D, average amplitude of the spontaneous EPSCs (8 cells). E, mean of the average frequency of spontaneous EPSCs (n= 8)
Figure 3
Figure 3. Readily releasable pool
The size of the readily releasable pool (RRP) of vesicles was estimated from a high frequency train. EPSC peak amplitudes were summed and corrected for replenishment. Replenishment was estimated from the responses to the last stimuli and was assumed to be constant. Release probability (Pr) was calculated by dividing the first EPSC amplitude by the RRP estimate. A: top, EPSCs in response to 100 Hz stimulus trains before (Control) and after (Post-tetanus) a 20 Hz tetanus of 5 min; bottom: same stimulation in the presence of 2 mm kynurenic acid. B, average increase in the RRP and Pr in normal Ringer solution (n= 9) and in kynurenic acid (n= 6). C, release probability of the individual experiments. Black lines are the data points measured in normal Ringer solution. Grey dotted lines were measured in the presence of kynurenic acid
Figure 4
Figure 4. Decay of post-tetanic potentiation
A, the evoked EPSC amplitudes of four cells were normalized to baseline and the average was plotted versus time after the tetanus (n= 4 +s.e.m.). A single exponential function back to baseline was fitted through the data (grey line). Time constant was 9.1 min. Example traces can be seen in the inset, from left to right: last EPSC before the tetanus and 1.4, , 15 and 25 min after the tetanus. B, in the same cells as shown in A, a second tetanus was given, but now only the spontaneous release was monitored. Spontaneous release was binned (bin size 10 s), normalized to baseline, and fitted with a single exponential function. Time constant was 2.3 min (grey line). Example traces, before the tetanus and 1.4, 5 and 15 min after the tetanus, can be seen in the inset. C, semilogarithmic plot of the decay of spontaneous (○) and evoked (▪) release following the tetanus. The single exponential fits in A and B are shown as continuous lines
Figure 5
Figure 5. Induction characteristics
The number of stimuli in a 20 Hz tetanus was varied between 100 and 6000. After each tetanus, the cell was stimulated at a frequency of 0.1 Hz until the EPSCs had returned to baseline. A, EPSC amplitudes before, during and after the tetanus are plotted. In A, five tetani of different duration were applied: 100 (□, pink), 500 (⊕, brown), 1000 (⊕, green) and 2000 stimuli (▵, blue). The experiment was started (○, red) and ended (♦, black) with a train of 6000 stimuli. The data points were fitted to baseline with a single exponential function (continuous lines), with time constants of 500 and 370 s (6000), 370 s (2000), 480 s (1000) and 410 s (500 stimuli). Inset: examples of the EPSCs. Left traces were measured before, right traces after, the tetanus, which contained from top to bottom, 100, 500, 1000, 2000 and 6000 stimuli, respectively. B, plot of the average release probability versus the number of stimuli in the tetanus. (n= 6 for 0 and 6000 stimuli, n= 3 for the other stimuli). Release probability was calculated by dividing the EPSC amplitude by the pool size estimate. C, plot of the average spontaneous release frequency in the first minute after the tetanus. In B and C, the data were fitted with an exponential function (continuous lines)
Figure 6
Figure 6. Relation between residual calcium and PTP time course
A, a terminal was filled with 50 μm fura-2. Images were obtained at 360 nm (isosbestic wavelength; left) and 380 nm (calcium-sensitive wavelength; right). At the excitation wavelength of 380 nm, fura-2 fluorescence decreased upon calcium binding. Calibration bar, 10 μm. The last pair of images before (top) and the first after the tetanus (bottom) are shown. B, mean calcium concentration for cells filled with fura-2 (black symbols, n= 4), or with fura-2 plus EGTA (grey symbols, n= 5). During the tetanus (t=−5 to 0 min) the high-affinity calcium dye approached saturation in both conditions (data points not shown). C, mean normalized EPSC amplitudes for cells filled with fura-2 (black) or fura-2 plus EGTA (grey). D, relation between EPSC size and [Ca2+] during the decay phase of PTP for an individual experiment. Continuous line has a slope of 17 pA nm−1 (r= 0.93). E, same data as in D, now shown on a double-logarithmic plot. Continuous line is a fit of the relation between EPSC amplitude and residual calcium with a power function: EPSC amplitude =K1[Ca2+]m+K2, where K1 and K2 are scaling constants. Best fit was obtained for m= 0.55. F, semi-logarithmic plot of the decay of calcium and EPSC size. Symbols correspond to the symbols used in panels B and C. Both the [Ca2+] and the EPSC sizes are normalized to their respective average values during the time period when the first three EPSCs after the tetanus were measured (1.5–2 min after the tetanus). Continuous black line is the fit of [Ca2+] in 50 μm fura-2 with a single exponential function with time constant 9.4 min. Continuous grey line is the fit of [Ca2+] in 50 μm fura-2 plus 1 mm EGTA, with time constant 3.3 min. Dashed black line is the fit of EPSC decay in the absence of EGTA, with time constant 4.7 min. Dashed grey line is the fit of EPSC decay in the presence of EGTA, with time constant 3.5 min. G, relation between PTP decay and residual calcium. A linear correlation (r= 0.78) was found (continuous line; P < 0.05)
Figure 7
Figure 7. Simulation of PTP decay
A, simulation of the decay of evoked and spontaneous release according to a release model based on the Hill equation (eqn (3); see Theory section in Methods for details). A good fit of the curve in Fig. 2D of Meinrenken et al. (2003), which describes the probability that a vesicle of the readily releasable pool is released as a function of the peak calcium concentration reached during an action potential, can be obtained with Kd= 11.4 μm and m= 4.4 (results not shown). For a release probability of 0.25, a concentration of 8.9 μm is then needed (Bollmann et al. 2000). Basal calcium concentration was 40 nm. In addition, for the simulation it was assumed that F, which is the ratio of Kd and [Ca], depended linearly on the residual calcium. As a result, a decrease of F after the tetanus recovered with the same time course as residual calcium. Continuous thin line gives the decay of residual calcium (time constant 8.5 min). Continuous thick line is the decay of evoked release (apparent time constant 7.3 min). Dotted line is the decay of spontaneous release (apparent time constant 2.0 min). Decays were normalized to the respective amplitudes at t= 0. To increase Pr twofold, as was experimentally observed during PTP, the change in F after the tetanus (β, eqn (4)) would have to be about 0.2 (i.e. F would have to be about 20% smaller than control) directly after the tetanus, which translates as an increase in the apparent affinity of the calcium sensor of about 2 μm. B: top, release probability of releasable vesicles (Pr) as a function of the fractional change in F directly after a tetanus (β0); bottom, simulation of the relation between the ratio of the apparent time constant for decay of PTP and the time constant for decay of residual calcium (τPTPCa) and β0. Continuous line is computed for evoked release, dotted line has been computed for spontaneous release. Simulations were performed as described in A, with residual calcium immediately after the tetanus in each case 170 nm, while Kd was varied to get the appropriate changes in F. F decayed with the same time course as residual calcium. For large values of β, evoked release saturated and – in contrast to what was experimentally observed – plateaued after the tetanus. To be able to describe the decay of PTP satisfactorily by a single exponential function, the fit was therefore restricted to the period starting 5 min after the tetanus

Similar articles

Cited by

References

    1. Alle H, Jonas P, Geiger JR. PTP and LTP at a hippocampal mossy fiber-interneuron synapse. Proc Natl Acad Sci U S A. 2001;98:14708–14713. - PMC - PubMed
    1. Angleson JK, Betz WJ. Intraterminal Ca2+ and spontaneous transmitter release at the frog neuromuscular junction. J Neurophysiol. 2001;85:287–294. - PubMed
    1. Augustine GJ. How does calcium trigger neurotransmitter release? Curr Opin Neurobiol. 2001;11:320–326. - PubMed
    1. Bao JX, Kandel ER, Hawkins RD. Involvement of pre-and postsynaptic mechanisms in posttetanic potentiation at Aplysia synapses. Science. 1997;275:969–973. - PubMed
    1. Billups B, Forsythe ID. Presynaptic mitochondrial calcium sequestration influences transmission at mammalian central synapses. J Neurosci. 2002;22:5840–5847. - PMC - PubMed

Publication types

LinkOut - more resources