. 2005 Feb 15;102(7):2460-5.
doi: 10.1073/pnas.0409474102. Epub 2005 Feb 4.

Quantitative trait locus mapping and DNA array hybridization identify an FLM deletion as a cause for natural flowering-time variation

Affiliations

Quantitative trait locus mapping and DNA array hybridization identify an FLM deletion as a cause for natural flowering-time variation

Jonathan D Werner et al. Proc Natl Acad Sci U S A. .

Abstract

Much of the flowering time variation in wild strains of Arabidopsis thaliana is due to allelic variation at two epistatically acting loci, FRIGIDA (FRI) and FLOWERING LOCUS C (FLC). FLC encodes a MADS (MCM1/AGAMOUS/DEFICIENS/SRF1) domain transcription factor that directly represses a series of flowering-promoting genes. FRI and FLC, however, do not explain all of the observed variation, especially when plants are grown in short days. To identify loci that act in addition to FRI and FLC in controlling flowering of natural accessions, we have analyzed a recombinant inbred line population derived from crosses of accession Niederzenz (Nd) to Columbia, both of which contain natural FRI lesions. Quantitative trait locus mapping and genomic DNA analysis by microarray hybridization were used to identify candidate genes affecting variation in flowering behavior. In both long and short days, the quantitative trait locus of largest effect, termed FLOWERING 1 (FLW1), was found to be associated with a Nd-specific deletion of FLOWERING LOCUS M (FLM), which encodes a floral repressor closely related to FLC. Analysis of near isogenic lines and quantitative transgenic complementation experiments confirmed that the FLM deletion is, in large part, responsible for the early flowering of the Nd accession.


Figures

Fig. 1.
Fig. 1.
Genetic map of for Nd/Col RIL population. The 79 molecular markers are described in the supporting information.
Fig. 2.
Fig. 2.
Distribution of flowering times for Nd/Col RILs. Flowering time was measured for the 96 lines as DTF in LD (Upper) and SD (Lower). Arrowheads and horizontal bars indicate parental means and two standard deviations, respectively.
Fig. 3.
Fig. 3.
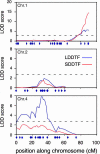
QTL maps of chromosomes 1, 2, and 4 for DTF in LD (blue) or SD (red). Results from interval mapping using bqtl are shown with logarithm of odds scores on the y axis versus position on the chromosomes on the x axis. Marker positions are indicated at the bottom of each chromosome. The dotted gray line corresponds to a logarithm of odds score threshold of 2.64, which represents a P = 0.05 genome wide threshold set by permutations.
Fig. 4.
Fig. 4.
Deletion of the FLM locus in Nd. (A) Results of linear-clustering algorithm based on hybridization of labeled genomic DNA from Nd-1 and Col to ATH1 expression arrays. Closed circles represent d-statistics for each feature; single-feature polymorphisms are shown in blue, and nonsignificant features are shown in black. The lines correspond to clusters of features (green) that qualify as potential deletions (red) (see ref 31). The FLM deletion in Nd-1, verified by sequencing, is indicated by a black line. FLM exons are shown in blue. The deleted sequence is flanked by parallel repeats of GTATAAT. (B) Fine mapping of FLW1 QTL. Genotypes at markers F22K20, FLM, and T14N5-2 are shown for two plants with recombination events flanking FLM (see Materials and Methods). Flowering time means were derived for progeny of recombinants grown in SD and genotyped at FLM. Error bars denote 95% confidence intervals. Regression of DTF on the number of Col alleles showed the additive allele effect (2a) to be 12.1 days (P < 10-7) in Rec820 and 11.5 days (P < 10-7) in Rec88; dominance effects could not be rejected.
Fig. 5.
Fig. 5.
Flowering time of 55 T1 lines transformed with the FLM-Col locus grown in SD. Fifty-five of the 74 T1 lines in the FLW1 NIL flowered within the 6 months of the experiment. Flowering time ranges and means of untransformed FLW1 NIL, Nd-1, and Col-5 are indicated by the corresponding horizontal lines and arrows.

Similar articles

Cited by

References

    1. Sheldon, C. C., Burn, J. E., Perez, P. P., Metzger, J., Edwards, J. A., Peacock, W. J. & Dennis, E. S. (1999) Plant Cell 11, 445-458. - PMC - PubMed
    1. Michaels, S. D. & Amasino, R. M. (1999) Plant Cell 11, 949-956. - PMC - PubMed
    1. Michaels, S. D., Bezerra, I. C. & Amasino, R. M. (2004) Proc. Natl. Acad. Sci. USA 101, 3281-3285. - PMC - PubMed
    1. Henderson, I. R., Shindo, C. & Dean, C. (2003) Annu. Rev. Genet. 37, 371-392. - PubMed
    1. Bastow, R., Mylne, J. S., Lister, C., Lippman, Z., Martienssen, R. A. & Dean, C. (2004) Nature 427, 164-167. - PubMed

Publication types