. 2005 Feb 15;102(7):2643-8.
doi: 10.1073/pnas.0406874102. Epub 2005 Feb 4.

Convergent signaling by acidosis and receptor activator of NF-kappaB ligand (RANKL) on the calcium/calcineurin/NFAT pathway in osteoclasts

Affiliations

Convergent signaling by acidosis and receptor activator of NF-kappaB ligand (RANKL) on the calcium/calcineurin/NFAT pathway in osteoclasts

Svetlana V Komarova et al. Proc Natl Acad Sci U S A. .

Abstract

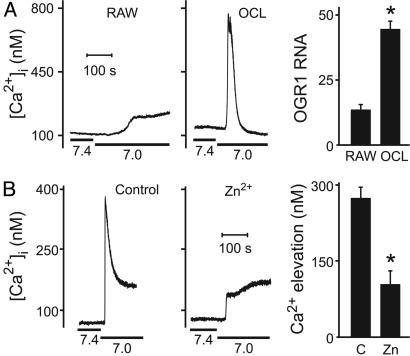
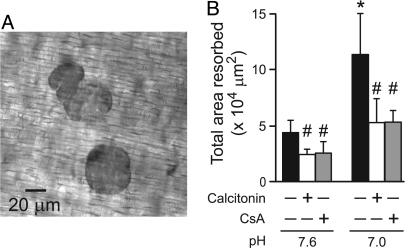
Systemic acidosis has detrimental effects on the skeleton, and local acidosis coincides with bone destruction in inflammatory and metastatic diseases. Acidification dramatically enhances osteoclastic resorption, although the underlying mechanism has remained elusive. We investigated the effect of acidosis on the osteoclastogenic transcription factor NFATc1, which upon dephosphorylation translocates from the cytoplasm to nuclei. Lowering extracellular pH dramatically increased accumulation of NFATc1 in nuclei of rat and rabbit osteoclasts to levels comparable with those induced by the proresorptive cytokine receptor activator of NF-kappaB ligand (RANKL). Activation of NFATc1 by RANKL was mediated by means of prolonged stimulation of the Ca2+/calmodulin-dependent protein phosphatase, calcineurin. In contrast, NFATc1 activation by acidosis involved stimulation of calcineurin and suppression of NFATc1 inactivation. Acidosis, like RANKL, induced transient elevation of cytosolic free Ca2+ concentration ([Ca2+]i), which persisted in Ca2+-free media and was abolished by inhibition of phospholipase C or depletion of intracellular Ca2+ stores. Real-time-PCR of osteoclast-like cells generated from RAW 264.7 cells revealed high levels of expression of ovarian cancer G protein-coupled receptor 1, which links extracellular acidification to elevation of [Ca2+]i. In addition, the calcineurin inhibitor cyclosporin A suppressed the stimulatory effect of acidification on resorption, implicating NFAT in mediating the actions of acidosis on osteoclast activity. In summary, acidification and RANKL induce signals in osteoclasts that converge on the Ca2+/calcineurin/NFAT pathway. Acidosis acts directly on osteoclasts to activate NFATc1 and stimulate resorption.


Figures

Fig. 1.
Fig. 1.
Effect of extracellular pH on nuclear accumulation of NFATc1. Rat osteoclasts were exposed to different pH levels for 45 min and then fixed. NFATc1 localization was assessed by immunofluorescence (green) and nuclei were stained by using TOTO-3 (red). (A) In most osteoclasts maintained at pH 7.6, NFATc1 was localized predominantly in the cytoplasm. (B) Extracellular acidification to pH 7.0 induced nuclear accumulation of NFATc1. Yellow in Right (Superimposed) indicates nuclear localization of NFATc1. Calibration bars indicate 20 μm.
Fig. 2.
Fig. 2.
Effects of pH and RANKL on nuclear accumulation of NFATc1. NFATc1 nuclear accumulation was assessed by using immunofluorescence and expressed as a percentage of the total number of rat osteoclasts. Data are means ± SEM. Differences were assessed by one-way ANOVA, followed by a Bonferroni test. (A) pH dependence of NFATc1 nuclear accumulation. pH of the medium was adjusted to the indicated level by using metabolic (•) or respiratory (○) protocols. Osteoclasts were incubated for 60 min and then fixed. NFATc1 nuclear accumulation at the three most acidic points was significantly greater than that at the three most alkaline points (P < 0.05, from three to nine independent experiments). Sigmoid curve was fit by nonlinear regression. (B) Effect of RANKL on nuclear accumulation of NFATc1. Osteoclasts were incubated in media of indicated pH with or without RANKL (1 μg/ml) for 60 min then fixed. *, Significant difference for the effect of RANKL (P < 0.001, from three to 11 independent experiments). (C) OPG prevented the effect of RANKL but not the effect acidification on NFATc1 nuclear accumulation in osteoclasts. Osteoclasts were incubated in medium (i) containing OPG (10 μg/ml) or vehicle, (ii) at the indicated pH, and (iii) with or without RANKL (1 μg/ml) for 45 min and fixed. *, Significant difference for the effect of OPG (P < 0.05, from three independent experiments). (D) The calcineurin inhibitor cyclosporin A prevented nuclear accumulation of NFATc1 induced by acidosis and RANKL. Cyclosporin A (CsA, 1 μM) or vehicle was added for the final 30 min of preincubation at pH 7.6. Osteoclasts were then incubated in medium (i) containing CsA or vehicle, (ii) at the indicated pH, and (iii) with or without RANKL (1 μg/ml) for 60 min and fixed. *, Significant difference for the effect of CsA (P < 0.01, from three independent experiments).
Fig. 3.
Fig. 3.
Kinetics of NFATc1 activation and inactivation. NFATc1 nuclear accumulation was assessed by using immunofluorescence and expressed as a percentage of the total number of rat osteoclasts. Data are means ± SEM (from three to 14 independent experiments), and differences were assessed by one-way ANOVA, followed by a Bonferroni test. (A) At time 0, osteoclasts were placed in medium at pH 7.6 (Control, white circles) or 7.0 (green circles). At 45 min (arrowhead), some samples were moved to medium at pH 7.6 (blue squares) or containing cyclosporin A (CsA, 2 μM) at pH 7.0 (yellow triangles). *, Significant difference for pH 7.6 (blue) or CsA (yellow) compared with pH 7.0 (green) for the same time points (P < 0.05). All control samples (white), except at 0 and 90 min, were significantly different from pH 7.0 (green) (P < 0.05). (B) At time 0, osteoclasts were placed in medium at pH 7.6 with RANKL (1 μg/ml, red circles) or vehicle (Control, white circles, repeated from A). At 45 min (arrowhead), some samples were moved to medium at pH 7.6 without RANKL (Vehicle, blue squares) or containing cyclosporin A (CsA, 2 μM) in the continued presence of RANKL (yellow triangles). *, Significant difference for Vehicle (blue) or CsA (yellow) compared with RANKL (red) for the same time points (P < 0.05). All control samples (white), except at 0 and 90 min, were significantly different from RANKL (red) (P < 0.05).
Fig. 4.
Fig. 4.
Acidification elicits transient rise of [Ca2+]i in osteoclasts. Single rat osteoclasts were loaded with fura-2, and [Ca2+]i was monitored by microspectrofluorimetry. Bars below the Ca2+ traces indicate extracellular pH. (A) Upon acidification, [Ca2+]i peaked and then declined to a plateau, returning to basal levels after alkalinization. Response is representative of 16 of 18 tested osteoclasts. (B) Alkalinization had no effect on [Ca2+]i (representative of five of six trials on four osteoclasts). Time scale is the same for A and B. (C) Acidification induced elevation of [Ca2+] in Ca2+i-free buffer containing 0.5 mM EGTA (0 Ca2+). Response is representative of 13 of 14 osteoclasts tested. (D) Inhibition of PLC or depletion of Ca2+ stores abolished acid-induced elevation of [Ca2+]i. Osteoclasts were pretreated with vehicle (Control), the PLC inhibitor U73122 (1 μM, 10 min), its inactive analog U73343 (1 μM, 10 min), or the endoplasmic reticulum Ca2+-ATPase inhibitor thapsigargin (5 μM, 30 min). Amplitudes of acid-induced Ca2+ transients under each condition are shown expressed as a percentage of matched controls. Data are means ± SEM assessed by one-way ANOVA and a Bonferroni test for the effects of U73122 and U73343 (*, P < 0.05, n = 5 for vehicle, n = 7 for U73122, and n = 6 for U73343) or by Student's t test for the effect of thapsigargin (*, P < 0.0005, n = 6 for vehicle and n = 6 for thapsigargin).
Fig. 5.
Fig. 5.
Expression and function of OGR1 in osteoclast-like cells and osteoclasts. (A) RAW 264.7 cells were grown for 5 or 6 days without (RAW) or with RANKL to induce differentiation of osteoclast-like cells (OCL). (Left and Center) Acidification from 7.4 to 7.0 was induced where indicated by bar below the Ca2+ traces. (Left) Response is representative of nine of nine samples of tested undifferentiated RAW 264.7 cells. (Center) Response is representative of seven of eight tested single osteoclast-like cells. (Right) Quantitative real-time RT-PCR was performed by using a primer/TaqMan probe set specific for OGR1 on RNA isolated from undifferentiated RAW 264.7 cells and differentiated osteoclast-like cells. OGR1 mRNA levels were normalized to endogenous ribosomal RNA and expressed relative to levels in liver. Data are means ± SEM, and difference was assessed by using Student's t test. *, P < 0.005, from three independent experiments. (B) OGR1 antagonist Zn2+ inhibits acid-induced elevation of [Ca2+]i in authentic rat osteoclasts. (Left) Representative response in control rat osteoclast. (Center) Response is diminished after treatment with Zn2+ (100 μM, 10 min in the bath). (Right) After treatment with Zn2+, amplitudes of acid-induced Ca2+ transients are significantly decreased. *, P < 0.001. Data are means ± SEM. Difference was assessed by using Student's t test; n = 16 for control (C) and n = 9 for Zn2+-treated (Zn) osteoclasts.
Fig. 6.
Fig. 6.
Role of NFAT in mediating the effects of acidosis on osteoclastic resorption. Rabbit osteoclasts were plated on dentin slices and treated with calcitonin (10 μM) or cyclosporin A (CsA, 1 μM) for 30 min at pH 7.6. In some samples, the pH was then altered to 7.0 by increasing the partial pressure of CO2 (respiratory acidosis). Experiments were stopped at 24 h, and the number of osteoclasts was assessed. The mean number of osteoclasts per slice was 170 ± 9, and no significant differences were observed among conditions. (A) Phase-contrast micrograph of resorption pits. (B) Quantification of the total area resorbed per slice. Data are means ± SEM, for three independent experiments, each performed in triplicate. Differences were assessed by using Student's t test. *, Significant difference for the effect of acidosis; #, significant difference for the effects of calcitonin or CsA, compared with untreated samples at the same pH.

References

    1. Goto, K. (1918) J. Biol. Chem. 36, 355-376.
    1. Arnett, T. (2003) Proc. Nutr. Soc. 62, 511-520. - PubMed
    1. Bushinsky, D. A. (2001) Eur. J. Nutr. 40, 238-244. - PubMed
    1. Kraut, J. A., Mishler, D. R. & Kurokawa, K. (1984) Kidney Int. 25, 608-612. - PubMed
    1. Arnett, T. R. & Dempster, D. W. (1986) Endocrinology 119, 119-124. - PubMed

Publication types

MeSH terms

LinkOut - more resources