. 2005 Mar;137(3):1018-26.
doi: 10.1104/pp.104.054270. Epub 2005 Feb 4.

Iron-mediated control of the basic helix-loop-helix protein FER, a regulator of iron uptake in tomato

Affiliations

Iron-mediated control of the basic helix-loop-helix protein FER, a regulator of iron uptake in tomato

Tzvetina Brumbarova et al. Plant Physiol. 2005 Mar.

Abstract

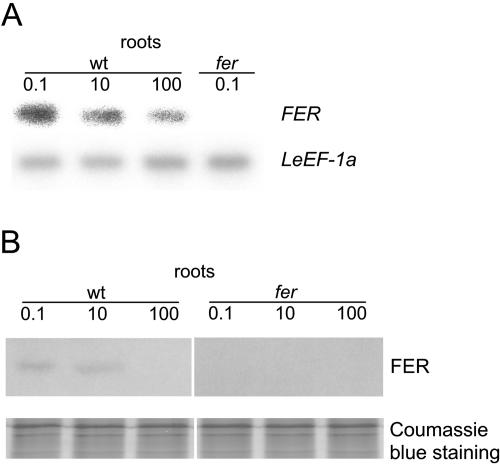
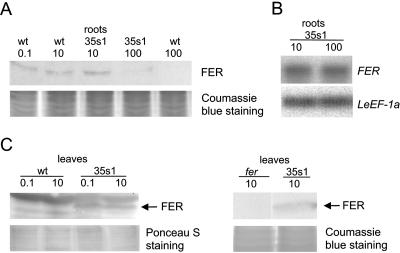
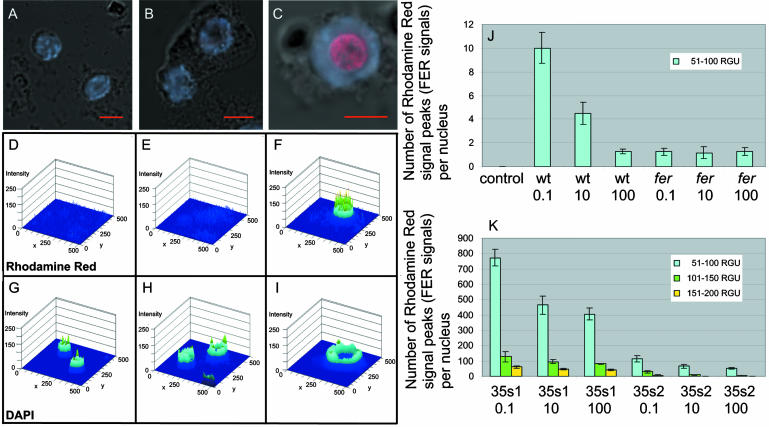
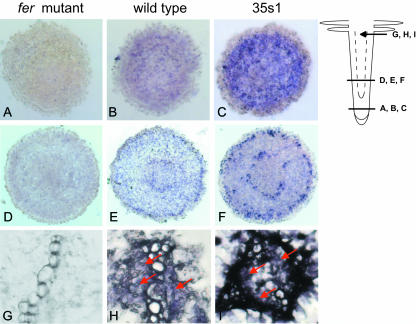
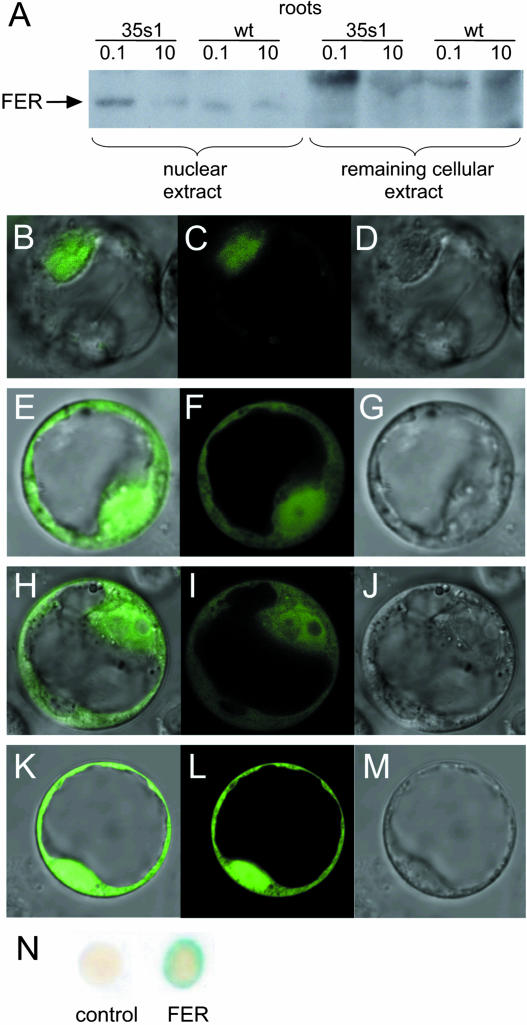
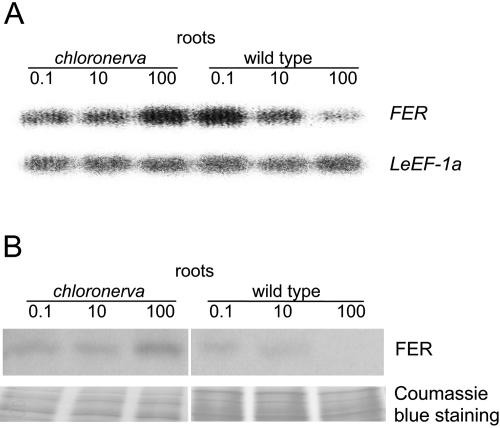
Root iron mobilization genes are induced by iron deficiency downstream of an unknown signaling mechanism. The FER gene, encoding a basic helix-loop-helix domain protein and putative transcription factor, is required for induction of iron mobilization genes in roots of tomato (Lycopersicon esculentum). To study upstream regulatory events of FER action, we examined the control of FER gene and FER protein expression in response to iron nutritional status. We analyzed expression of the FER gene and FER protein in wild-type plants, in mutant plants with defects in iron uptake regulation, and in 35S transgenic plants that overexpressed the FER gene. An affinity-purified antiserum directed against FER epitopes was produced that recognized FER protein in plant protein extracts. We found that the FER gene and FER protein were consistently down-regulated in roots after generous (100 mum, physiologically optimal) iron supply compared to low (0.1 mum) and sufficient (10 mum) iron supply. FER gene and FER protein expression were also occasionally down-regulated at sufficient compared to low iron supply. Analysis of FER protein expression in FER overexpression plants, as well as cellular protein localization studies, indicated that FER was down-regulated by high iron at the posttranscriptional level. The FER protein was targeted to plant nuclei and showed transcriptional activation in yeast (Saccharomyces cerevisiae). FER protein regulation in the iron accumulation mutant chloronerva indicated that FER protein expression was not directly controlled by signals derived from iron transport. We conclude that FER is able to affect transcription in the nucleus and its action is controlled by iron supply at multiple regulatory levels.


Figures

Figure 1.
Figure 1.
Regulation of FER gene and FER protein expression by iron availability in roots. Wild-type and fer mutant plants were grown in the presence of 0.1, 10, or 100 μm FeNaEDTA. A, Semiquantitative RT-PCR analysis of FER mRNA levels in tomato roots. FER expression levels were normalized according to the constitutively expressed LeEF-1a gene. FER signals were absent in the fer plants due to the presence of an insertion within the region to be amplified. B, Western-blot analysis on total protein extracts; 9 μg protein were loaded in each lane. Coomassie Blue staining was used to demonstrate equal loading with proteins.
Figure 2.
Figure 2.
A, Western-blot analysis using anti-N-FER antiserum on total protein extracts from roots of wild-type and 35s1 transgenic plants that overexpressed the FER gene, grown at 0.1, 10, or 100 μm FeNaEDTA. B, Semiquantitative RT-PCR analysis of FER mRNA levels in tomato roots of 35s1 plants grown at sufficient and high iron supply. FER expression levels were normalized according to the constitutively expressed LeEF-1a gene. C, Western-blot analysis using anti-N-FER antiserum on total protein extracts from leaves of wild-type and 35s1 transgenic plants grown at 0.1 or 10 μm FeNaEDTA (left), and western-blot analysis using anti-FER antiserum (right). FER protein is indicated by an arrow; 9 μg protein were loaded in each lane in A and C. Coomassie Blue or Ponceau S staining was used to demonstrate equal loading with proteins.
Figure 3.
Figure 3.
Immunolocalization of FER on single root tip nuclei detected by anti-N-FER antiserum, followed by rhodamine red-coupled anti-rabbit IgG and counterstained with DAPI. A to C, Superimposed confocal images of rhodamine red, DAPI, and differential interference contrast (DIC). D to I, Diagrams, created by the laser scanning microscope 5 image software, presenting the respective rhodamine red (D–F) and DAPI (G–I) fluorescent signal peaks. The images represent the intensities of the fluorescent signals plotted on the same surface as the respective superimposed confocal image in A to C. Different levels of fluorescent signal intensities are represented by different colors: blue, 1 to 50 RGU; blue-green, 51 to 100 RGU; green, 101 to 150 RGU; and yellow, 151 to 200 RGU. The images represent examples for the fer mutant (A, D, and G), wild-type grown at 0.1 FeNaEDTA (B, E, and H), and 35s1 plants grown at 0.1 μm FeNaEDTA (C, F, and I). J, Mean number of fluorescent rhodamine red signal peaks per nucleus for the negative control (secondary antibody omitted), fer mutant, and wild-type plants under all iron supply conditions tested (μm FeNaEDTA). Only signal peaks with intensities between 51 to 100 RGU were counted. Higher signal intensities were not detected for these samples. sd are indicated; n = 10 nuclei. K, Mean number of fluorescent rhodamine red signal peaks per nucleus for 35s1 and 35s2 plants grown under different iron supply conditions (μm FeNaEDTA). Three levels of fluorescent signal intensities were counted, between 51 and 200 RGU. sd are indicated; n = 10 nuclei.
Figure 4.
Figure 4.
FER immunolocalization using anti-N-FER antiserum on 10-μm paraffin-embedded tomato root cross-sections of fer mutant (A, D, and G), wild-type (B, E, and H), and 35s1 (C, F, and I) plants. A to C, Cross-sections from the meristematic root zone. D to F, Cross-sections from the elongation root zone as indicated on the root scheme. G to I, Magnified views of the central cylinder from cross-sections in the root hair zone. The presence of FER protein was revealed by violet staining from indirect immunolabeling with a secondary antibody coupled to alkaline phosphatase.
Figure 5.
Figure 5.
FER protein subcellular localization and transcriptional activation. A, Western-blot analysis using anti-N-FER antiserum on cytosolic and remaining cellular protein fractions from roots of wild-type and 35s1 plants grown at 0.1 or 10 μm FeNaEDTA. The presence of FER protein is indicated by an arrow. B to M, Confocal images of Arabidopsis protoplasts transiently transformed with C-terminal GFP fusion constructs showing GFP fusion protein localization. B to D, Full-length FER∷GFP. E to G, N-FER∷GFP. H to J,C-FER∷GFP. K to M, Free GFP. B, E, H, and K, Superimposed GFP and DIC images. C, F, I, and L, GFP fluorescence. D, G, J, and M, DIC images. N, Yeast one-hybrid assay showing transcription activation capacity of FER. Transcription activation is visualized by a positive LacZ assay (dark color of the colonies). Empty vector was used as a negative control.
Figure 6.
Figure 6.
LeFER expression in chloronerva plants. A, Semiquantitative RT-PCR analysis of FER mRNA levels in roots from chloronerva and wild-type plants grown under deficient (0.1 μm), sufficient (10 μm), and generous (100 μm) iron supply. FER transcript abundance is normalized according to the constitutively expressed LeEF-1a gene. B, Western-blot analysis using anti-N-FER antiserum on total root extracts from chloronerva and wild-type plants grown under 0.1, 10, or 100 μm FeNaEDTA; 9 μg protein were loaded in each lane. Coomassie Blue staining was used to demonstrate equal loading with proteins.

References

    1. Andrews NC, Fleming MD, Gunshin H (1999) Iron transport across biologic membranes. Nutr Rev 57: 114–123 - PubMed
    1. Bagg A, Neilands JB (1987) Ferric uptake regulation protein acts as a repressor, employing iron (II) as a cofactor to bind the operator of an iron transport operon in Escherichia coli. Biochemistry 26: 5471–5477 - PubMed
    1. Bauer P, Thiel T, Klatte M, Bereczky Z, Brumbarova T, Hell R, Grosse I (2004) Analysis of sequence, map position and gene expression reveals conserved essential genes for iron uptake in Arabidopsis and tomato. Plant Physiol 136: 4169–4183 - PMC - PubMed
    1. Bereczky Z, Wang HY, Schubert V, Ganal M, Bauer P (2003) Differential regulation of nramp and irt metal transporter genes in wild type and iron uptake mutants of tomato. J Biol Chem 278: 24697–24704 - PubMed
    1. Brown JC, Ambler JE (1974) Iron-stress response in tomato (Lycopersicon esculentum) 1. Sites of Fe reduction, absorption and transport. Physiol Plant 31: 221–224

Publication types

Associated data