In vitro bioassay as a predictor of in vivo response
- PMID: 15698478
- PMCID: PMC549212
- DOI: 10.1186/1742-4682-2-3
In vitro bioassay as a predictor of in vivo response
Abstract
Background: There is a substantial discrepancy between in vitro and in vivo experiments. The purpose of the present work was development of a theoretical framework to enable improved prediction of in vivo response from in vitro bioassay results.
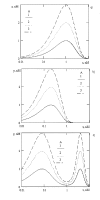
Results: For dose-response curve reaches a plateau in vitro we demonstrated that the in vivo response has only one maximum. For biphasic patterns of biological response in vitro both the bimodal and biphasic in vivo responses might be observed.
Conclusion: As the main result of this work we have demonstrated that in vivo responses might be predicted from dose-effect curves measured in vitro.
Figures


Similar articles
-
A case study: development of a bioassay for IL-1ra.Dev Biol (Basel). 2002;107:63-7. Dev Biol (Basel). 2002. PMID: 12079193
-
Development and validation of a real time PCR-based bioassay for quantification of neutralizing antibodies against human interferon-beta.J Immunol Methods. 2007 Apr 10;321(1-2):19-31. doi: 10.1016/j.jim.2006.12.012. Epub 2007 Feb 20. J Immunol Methods. 2007. PMID: 17335844
-
Development and validation of a quantitative cell-based bioassay for comparing the pharmacokinetic profiles of two recombinant erythropoietic proteins in serum.J Pharm Biomed Anal. 2007 Jan 17;43(2):666-76. doi: 10.1016/j.jpba.2006.07.050. Epub 2006 Sep 12. J Pharm Biomed Anal. 2007. PMID: 16971087
-
Vitellogenin synthesis in primary cultures of fish liver cells as endpoint for in vitro screening of the (anti)estrogenic activity of chemical substances.Aquat Toxicol. 2006 Oct 25;80(1):1-22. doi: 10.1016/j.aquatox.2006.07.013. Epub 2006 Sep 1. Aquat Toxicol. 2006. PMID: 16950525 Review.
-
Methods to evaluate the pharmacology of oral antiplatelet drugs.Herz. 2008 Jun;33(4):287-96. doi: 10.1007/s00059-008-3132-2. Herz. 2008. PMID: 18581078 Review.
Cited by
-
Effect of blood protein concentrations on drug-dosing regimes: practical guidance.Theor Biol Med Model. 2013 Mar 18;10:20. doi: 10.1186/1742-4682-10-20. Theor Biol Med Model. 2013. PMID: 23506635 Free PMC article.
-
Inhibition by tyroserleutide (YSL) on the invasion and adhesion of the mouse melanoma cell.Mol Med. 2007 Jan-Feb;13(1-2):14-21. doi: 10.2119/2006-00061.Yao. Mol Med. 2007. PMID: 17515953 Free PMC article.
-
Phase I clinical trial of continuous infusion of tyroserleutide in patients with advanced hepatocellular carcinoma.Med Oncol. 2012 Sep;29(3):1850-8. doi: 10.1007/s12032-011-0081-z. Epub 2011 Oct 11. Med Oncol. 2012. PMID: 21987077 Clinical Trial.
-
Pharmacokinetic evaluation of Chalcone derivatives with antimalarial activity in New Zealand White Rabbits.BMC Res Notes. 2021 Jul 8;14(1):264. doi: 10.1186/s13104-021-05684-8. BMC Res Notes. 2021. PMID: 34238361 Free PMC article.
-
Contribution of the active metabolite M1 to the pharmacological activity of tesofensine in vivo: a pharmacokinetic-pharmacodynamic modelling approach.Br J Pharmacol. 2008 Jan;153(1):164-74. doi: 10.1038/sj.bjp.0707539. Epub 2007 Nov 5. Br J Pharmacol. 2008. PMID: 17982477 Free PMC article.
References
-
- Lehninger AL, Nelson DL, Cox MM. Principles of biochemistry. Worth Publish: NY; 1982. p. 1013.
-
- Gilman AG. The pharmacological basis of therapeutics. McGrawHill: New York, St Louis, San Francisco; 1996. p. 1141.
-
- Clark AJ. General Pharmacology. In: Heubner W, Schuller J, editor. Handbuch der Experimentellen Pharmakologie, supplement 4. Springer Verlag: Berlin; 1937. pp. 4–190.
MeSH terms
LinkOut - more resources
Full Text Sources
Research Materials

