. 2005 Feb 7:6:5.
doi: 10.1186/1471-2156-6-5.

An automated system for measuring parameters of nematode sinusoidal movement

Affiliations

An automated system for measuring parameters of nematode sinusoidal movement

Christopher J Cronin et al. BMC Genet. .

Abstract

Background: Nematode sinusoidal movement has been used as a phenotype in many studies of C. elegans development, behavior and physiology. A thorough understanding of the ways in which genes control these aspects of biology depends, in part, on the accuracy of phenotypic analysis. While worms that move poorly are relatively easy to describe, description of hyperactive movement and movement modulation presents more of a challenge. An enhanced capability to analyze all the complexities of nematode movement will thus help our understanding of how genes control behavior.

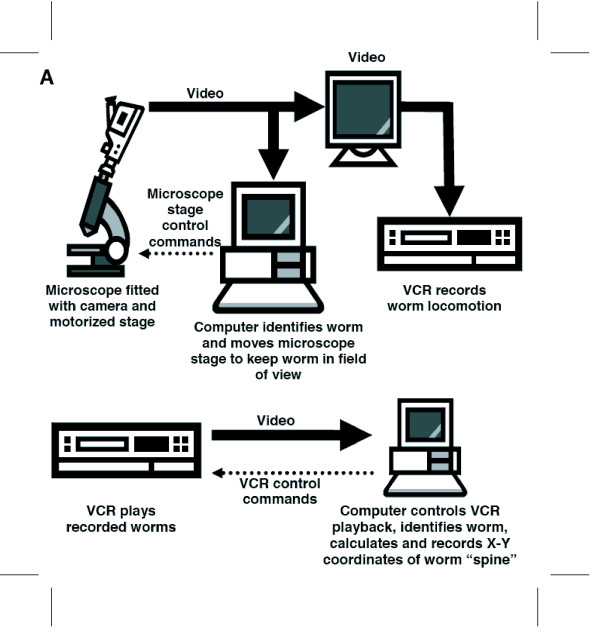
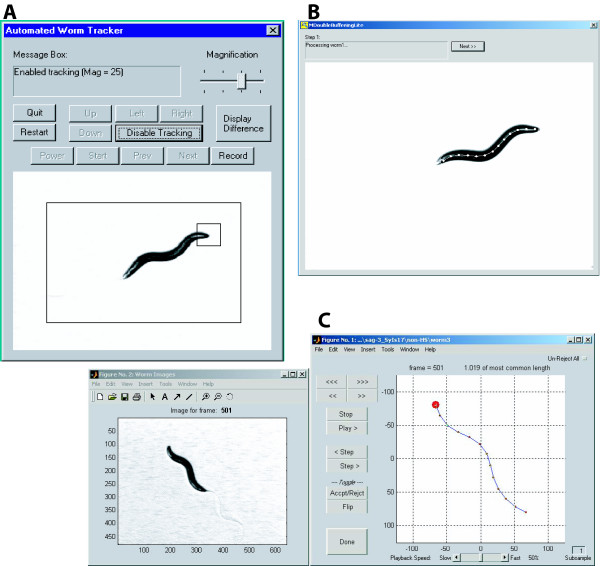
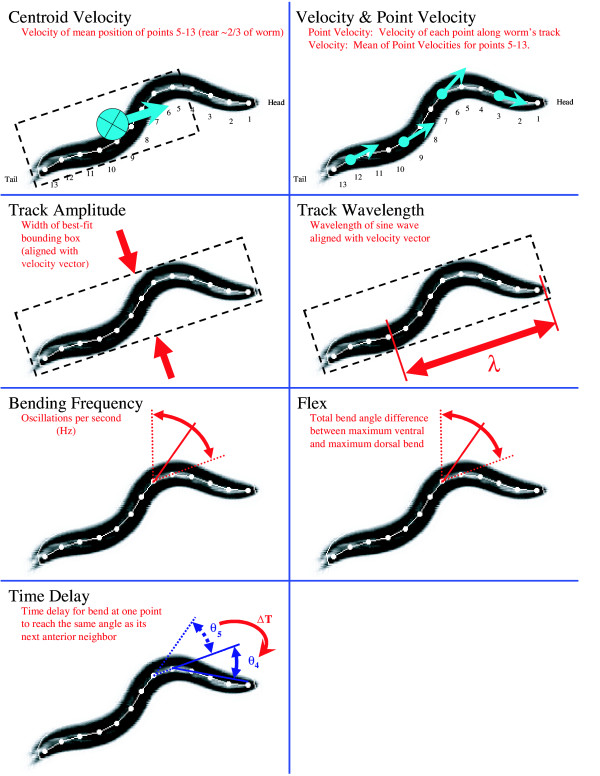
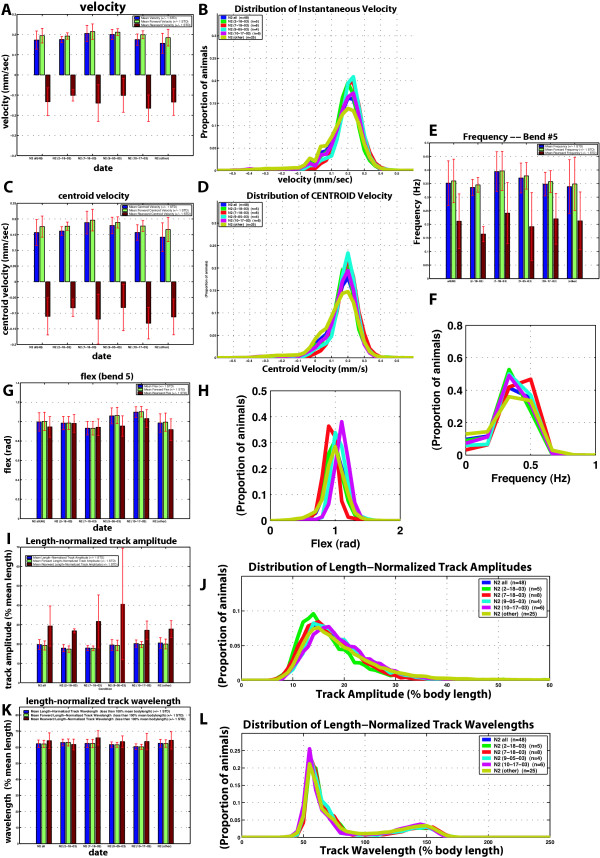
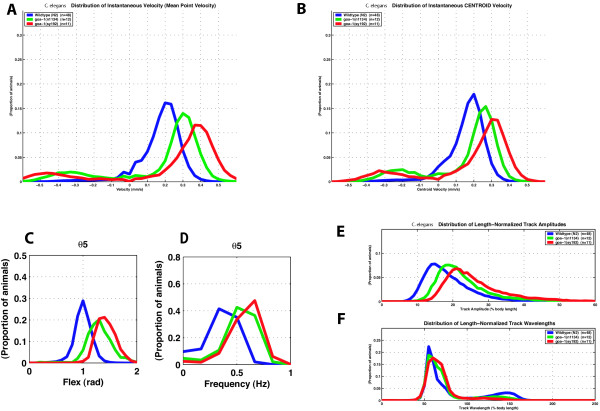
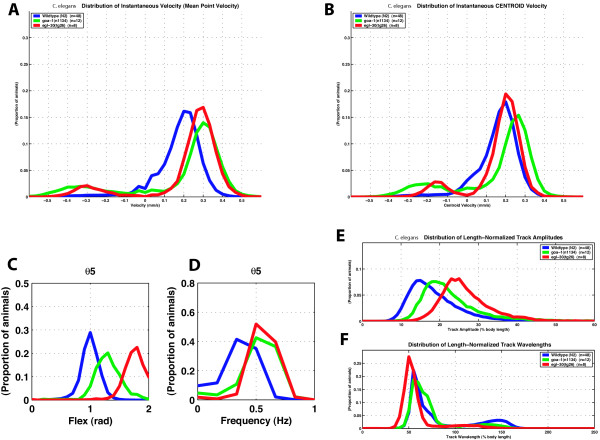
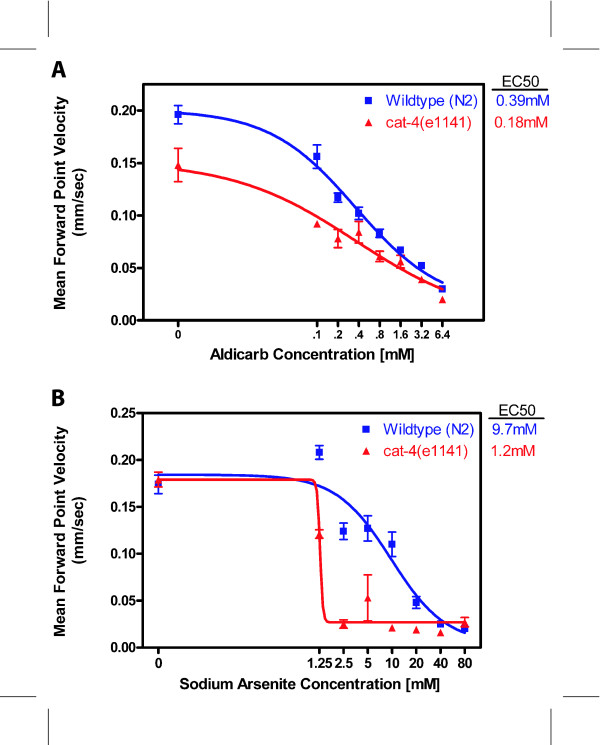
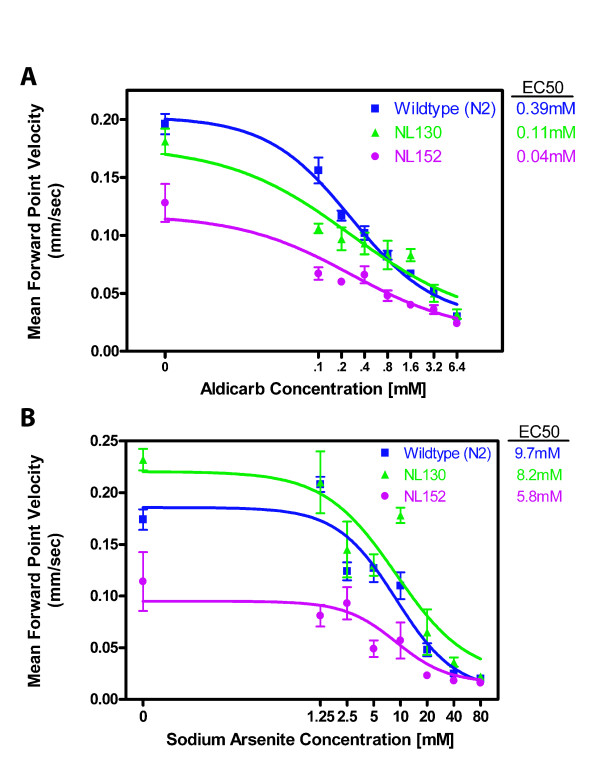
Results: We have developed a user-friendly system to analyze nematode movement in an automated and quantitative manner. In this system nematodes are automatically recognized and a computer-controlled microscope stage ensures that the nematode is kept within the camera field of view while video images from the camera are stored on videotape. In a second step, the images from the videotapes are processed to recognize the worm and to extract its changing position and posture over time. From this information, a variety of movement parameters are calculated. These parameters include the velocity of the worm's centroid, the velocity of the worm along its track, the extent and frequency of body bending, the amplitude and wavelength of the sinusoidal movement, and the propagation of the contraction wave along the body. The length of the worm is also determined and used to normalize the amplitude and wavelength measurements. To demonstrate the utility of this system, we report here a comparison of movement parameters for a small set of mutants affecting the Go/Gq mediated signaling network that controls acetylcholine release at the neuromuscular junction. The system allows comparison of distinct genotypes that affect movement similarly (activation of Gq-alpha versus loss of Go-alpha function), as well as of different mutant alleles at a single locus (null and dominant negative alleles of the goa-1 gene, which encodes Go-alpha). We also demonstrate the use of this system for analyzing the effects of toxic agents. Concentration-response curves for the toxicants arsenite and aldicarb, both of which affect motility, were determined for wild-type and several mutant strains, identifying P-glycoprotein mutants as not significantly more sensitive to either compound, while cat-4 mutants are more sensitive to arsenite but not aldicarb.

Conclusions: Automated analysis of nematode movement facilitates a broad spectrum of experiments. Detailed genetic analysis of multiple alleles and of distinct genes in a regulatory network is now possible. These studies will facilitate quantitative modeling of C. elegans movement, as well as a comparison of gene function. Concentration-response curves will allow rigorous analysis of toxic agents as well as of pharmacological agents. This type of system thus represents a powerful analytical tool that can be readily coupled with the molecular genetics of nematodes.


Figures

Figure 1
Figure 1
Tracker and Recognizer Schematic. A. Tracker. A Petri plate with worm is placed on a computer-controlled motorized stage. A joystick is used to center the worm in the field of view. The worm is recorded on VCR. B. Recognizer. The video tape is played into a computer by a computer-controlled VCR to recognize the worm and record its body posture and position as a function of time.
Figure 2
Figure 2
User Interfaces. A. Tracker User Interface. A simple GUI controls the tracking and recording. B. Recognizer2.1 User Interface. A simple user interface illustrates the progress of the recognition process. The image of the worm is shown with the spine and points superimposed. C. Wormproc User Interface. The interface for processing body posture shows a reference image of worm on plate to assist with worm orientation (left) and the main data processing control window (right) depicting an abstraction of worm during processing. If Recognizer2.1 inappropriately flips head and tail, it can be overridden with the Flip function. The program automatically rejects frames in which the worm length is outside of a calculated normal range, but these can be overridden with the Accpt/Rejct button, or all frames can be scored manually by hitting the Un-Reject All button.
Figure 3
Figure 3
Sample Attributes. The key attributes that are extracted by Wormproc program are shown schematically. Centroid velocity is the translation of the mean position of the rear two-thirds of the animal. Point velocity is the velocity of each point along the animal's track; velocity is the mean of the point velocities for points 5–13. Track amplitude is the maximum width of a box around the worm. Track wavelength is the length of the sine wave that fits the worm's posture. Bending frequency is the frequency of oscillations between adjacent segments. Flex is the maximum difference in angle between the ventral- and dorsal-most flexion at each articulation point. Time delay is the time required to propagate flexion between adjacent articulation points.
Figure 4
Figure 4
Variability of wild-type movement. For each metric, the aggregate statistics are shown along with individual days' experiments. Each daily group is designated by date. The 'other' group comprises 25 individuals that were tested on 16 different days in groups of 1–3. For each metric, a bar graph of the means is displayed (A, C, E, G, I, K) as well as histograms (B, D, F, H, J, L). For bar charts: Blue, mean; green, forward; red, backwards. For histograms: Blue, all 48 N2 animals (n = 48); Green, 2-18-03 dataset (n = 5); Red, 7-18-03 dataset (n = 8); light blue, 9-05-03 dataset (n = 4); magenta, 10-17-03 dataset (n = 6); yellow, other dataset (n = 25). n = number of individuals tested; n is the same for all panels. A. Mean velocity. B. Velocity histogram. C. Mean centroid velocity. D. Centroid velocity histogram. E. Mean frequency at bend 5. F. Frequency at bend 5 histogram. G. Mean flex at bend 5. H. Flex at bend 5 histogram. I. Mean length-normalized track amplitude. J. Length- normalized track amplitude histogram. K. Mean length-normalized wavelength. L. Length-normalized wavelength histogram. Each histogram curve represents the distribution of 632 to 1485 individual measurements per worm.
Figure 5
Figure 5
Comparison of two alleles of goa-1. Blue, wild-type (n = 48); green, goa-1 (n1134), a null allele (n = 12); red, goa-1 (sy192), an antimorphic allele (n = 11). n = number of individuals tested; n is the same for all panels. A. Distribution of velocity. B. Distribution of centroid velocity. C. Flex at bend 5. D. Frequency at bend 5. E. Length-normalized track amplitude. F. Length-normalized track wavelength. Each curve represents the distribution of 632 to 1485 individual measurements per worm. The population mean values reported in the text reflect only forward moving worms and are based on 550 to 1454 individual measurements per worm.
Figure 6
Figure 6
Comparison of goa-1 loss-of-function and egl-30 gain-of-function mutations. Blue, wild-type (n = 48); green, goa-1 (n1134), a null allele (n = 12); red, egl-30 (tg26), a gain-of-function allele of egl-30 Gq (n = 8). n = number of individuals tested; n is the same for all panels. A. Distribution of point velocity. B. Distribution of centroid velocity. C. Flex at bend 5. D. Frequency at bend 5. E. Length-normalized track amplitude. F. Length-normalized track wavelength. Each curve represents the distribution of 632 to 1485 individual measurements per worm. The population mean values reported in the text reflect only forward moving worms and are based on 550 to 1454 individual measurements per worm.
Figure 7
Figure 7
Toxicant sensitivity of wild-type and cat-4. A. Sensitivity to aldicarb. For N2, n = 16 animals for 0 mM aldicarb and 17 for all other concentrations. For cat-4, n = 6 for all concentrations. B. Sensitivity to arsenite. For N2, n = 17 animals for 2.5 mM sodium arsenite and 18 for all other concentrations. For cat-4, n = 4 for all concentrations.
Figure 8
Figure 8
Toxicant sensitivity of NL130 and NL152. A. Sensitivity to aldicarb. For N2, n = 16 animals for 0 mM aldicarb and 17 for all other concentrations. For NL130 and NL152, n = 6 for all concentrations. B. Sensitivity to arsenite. For N2, n = 17 animals for 2.5 mM sodium arsenite and 18 for all other concentrations. For NL130 and NL152, n = 4 for all concentrations.

References

    1. Brenner S. The genetics of Caenorhabditis elegans. Genetics. 1974;77:71–94. - PMC - PubMed
    1. White JG, Southgate E, Thomson JN, Brenner S. The structure of the nervous system of the nematode C. elegans. Philos Trans R Soc Lond B Biol Sci. 1986;314:1–340. - PubMed
    1. Hedgecock EM, Culotti JG, Hall DH. The unc-5, unc-6, and unc-40 genes guide circumferential migrations of pioneer axons and mesodermal cells on the epidermis in C. elegans. Neuron. 1990;4:61–85. doi: 10.1016/0896-6273(90)90444-K. - DOI - PubMed
    1. Ishii N, Wadsworth WG, Stern BD, Culotti JG, Hedgecock EM. UNC-6, a laminin-related protein, guides cell and pioneer axon migrations in C. elegans. Neuron. 1992;9:873–881. doi: 10.1016/0896-6273(92)90240-E. - DOI - PubMed
    1. Maruyama IN, Brenner S. A phorbol ester/diacylglycerol-binding protein encoded by the unc-13 gene of Caenorhabditis elegans. Proc Natl Acad Sci U S A. 1991;88:5729–5733. - PMC - PubMed

Publication types

Substances

LinkOut - more resources