. 2005 Feb 15;102(7):2567-72.
doi: 10.1073/pnas.0409727102. Epub 2005 Feb 8.

Genomic insights that advance the species definition for prokaryotes

Affiliations

Genomic insights that advance the species definition for prokaryotes

Konstantinos T Konstantinidis et al. Proc Natl Acad Sci U S A. .

Abstract

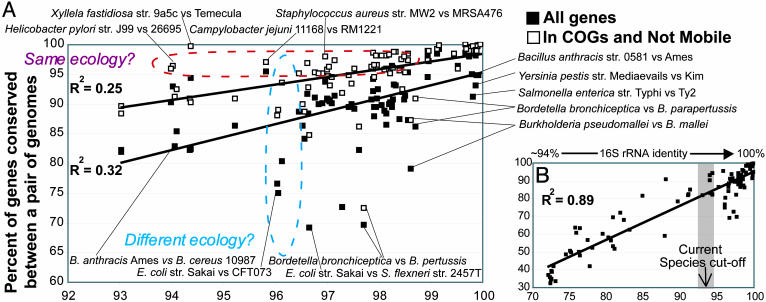
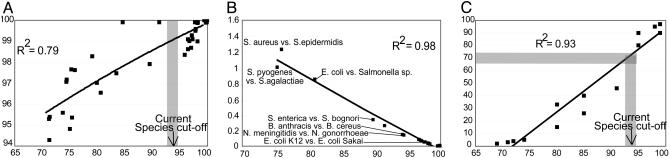
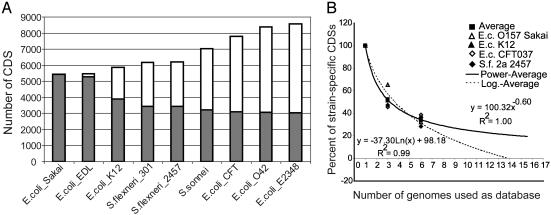
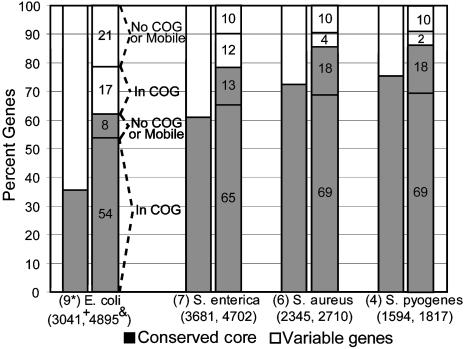
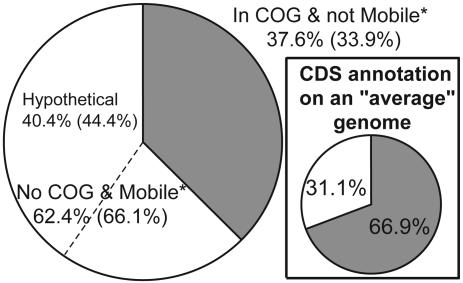
To help advance the species definition for prokaryotes, we have compared the gene content of 70 closely related and fully sequenced bacterial genomes to identify whether species boundaries exist, and to determine the role of the organism's ecology on its shared gene content. We found the average nucleotide identity (ANI) of the shared genes between two strains to be a robust means to compare genetic relatedness among strains, and that ANI values of approximately 94% corresponded to the traditional 70% DNA-DNA reassociation standard of the current species definition. At the 94% ANI cutoff, current species includes only moderately homogeneous strains, e.g., most of the >4-Mb genomes share only 65-90% of their genes, apparently as a result of the strains having evolved in different ecological settings. Furthermore, diagnostic genetic signatures (boundaries) are evident between groups of strains of the same species, and the intergroup genetic similarity can be as high as 98-99% ANI, indicating that justifiable species might be found even among organisms that are nearly identical at the nucleotide level. Notably, a large fraction, e.g., up to 65%, of the differences in gene content within species is associated with bacteriophage and transposase elements, revealing an important role of these elements during bacterial speciation. Our findings are consistent with a definition for species that would include a more homogeneous set of strains than provided by the current definition and one that considers the ecology of the strains in addition to their evolutionary distance.


Figures

Fig. 4.
Fig. 4.
Correlation between conserved genes and evolutionary distance for bacterial species. Each data point represents the percent of conserved genes between two strains plotted against their evolutionary distance, measured as ANI of all conserved genes between the strains. Black squares represent all genes and white squares represent the fraction of all genes that are well characterized genes (see Materials and Methods). (A) Only pairs of strains that should belong in the same species, according to the current species definition standard. (B) Pairs of more distantly related strains are also included.
Fig. 1.
Fig. 1.
Relationships between ANI, 16S rRNA, mutation rate, and DNA–DNA reassociation. Each black square represents the ANI of all conserved genes between two strains (x axes) plotted against (y axes) the 16S rRNA sequence identity (A), the average rate of synonymous nucleotide substitutions (B), and the DNA–DNA reassociation values (C) of the two strains. The shaded bar represents 93–94% ANI, which approximately corresponds to 70% DNA–DNA reassociation value, i.e., the species cutoff for prokaryotic species, according to the regression analysis in C. Shown in B is the average rate of synonymous substitutions for all genes in the genome. Comparable results were also obtained when analysis was restricted to genes with no apparent codon biases, or to only fourfold-degenerated sites, as opposed to all sites in a gene (data not shown).
Fig. 2.
Fig. 2.
Conserved gene core vs. genetic diversity within E. coli species. (A) Starting with the 5,447 CDSs in the genome of E. coli O157 strain Sakai, the next bar to the right represents how many unique CDSs in total are found in strain EDL and Sakai together (white bars), and how many of the 5,447 CDSs are conserved in strain EDL (gray bars), etc. Hence, white bars represent the total genetic diversity within species and gray bars represent the conserved gene core for species. (B) All CDSs in a strain (graph label) were searched against a database of an increasing number of genomes. The number of strain-specific CDSs, expressed as a percentage of the strain-specific CDSs when only one genome was used as the database, is plotted against the number of genomes used as the database. The almost identical genomes of E. coli O157 and Shigella flexneri 2a lineages were pooled together so that the seven genomes finally compared showed similar ANIs between each other. The logarithmic and power correlations shown are not statistically different from each other.
Fig. 3.
Fig. 3.
Conserved gene core vs. genetic diversity of species. The first column for each species (x axis) shows what fraction of all unique (nonredundant) genes found in all genomes of the species belongs to the species' conserved core (gray part) and what fraction is variable, i.e., not in the core (white part). The second column shows the same distribution for the average strain of the species. The functional annotation of the genes in the average strain of the species is also shown, as exemplified for E. coli. E. coli shows the greatest and Streptococcus pyogenes shows the lowest genetic diversity; note, however, that E. coli genomes are generally more distantly related between each other compared with genomes of the other species, based on ANI measurements (ANI between E. coli genomes is ≈96–97% vs. >98% for the others). *, number of genes used; +, number of genes in the core; &, number of genes in the average strain.
Fig. 5.
Fig. 5.
Functional distribution of genome-specific CDSs from 90 pairwise, whole-genome comparisons. Results using only strains showing >94 ANI are shown in parentheses. (Inset) Mean functional distribution of annotated CDSs for the 64 genomes deposited in GenBank as of October 2003. *Mobile, phage- or transposase-associated genes.

References

    1. Wayne, L. G., Brenner, D. J., Colwell, R. R., Grimont, P. A. D., Kandler, O., Krichevsky, M. I., Moore, L. H., Moore, W. E. C., Murray, R. G. E., Stackebrandt, E., et al. (1987) Int. J. Syst. Bacteriol. 37, 463-464.
    1. Brenner, D., Staley, J. & Krieg, N. (2000) Bergey's Manual of Systematic Bacteriology (Springer, New York).
    1. Stackebrandt, E., Frederiksen, W., Garrity, G. M., Grimont, P. A. D., Kampfer, P., Maiden, M. C. J., Nesme, X., Rossello-Mora, R., Swings, J., Truper, H. G., et al. (2002) Int. J. Syst. Evol. Microbiol. 52, 1043-1047. - PubMed
    1. Rossello-Mora, R. & Amann, R. (2001) FEMS Microbiol. Rev. 25, 39-67. - PubMed
    1. Cohan, F. M. (2002) Annu. Rev. Microbiol. 56, 457-487. - PubMed

Publication types

LinkOut - more resources