. 2005 Feb 15;102(7):2549-54.
doi: 10.1073/pnas.0409660102. Epub 2005 Feb 8.

A high-throughput, near-saturating screen for type III effector genes from Pseudomonas syringae

Affiliations

A high-throughput, near-saturating screen for type III effector genes from Pseudomonas syringae

Jeff H Chang et al. Proc Natl Acad Sci U S A. .

Abstract

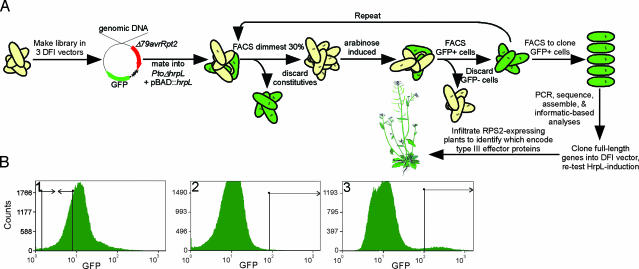
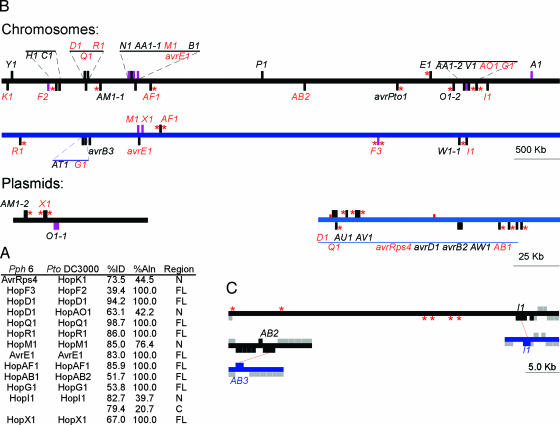
Pseudomonas syringae strains deliver variable numbers of type III effector proteins into plant cells during infection. These proteins are required for virulence, because strains incapable of delivering them are nonpathogenic. We implemented a whole-genome, high-throughput screen for identifying P. syringae type III effector genes. The screen relied on FACS and an arabinose-inducible hrpL sigma factor to automate the identification and cloning of HrpL-regulated genes. We determined whether candidate genes encode type III effector proteins by creating and testing full-length protein fusions to a reporter called Delta79AvrRpt2 that, when fused to known type III effector proteins, is translocated and elicits a hypersensitive response in leaves of Arabidopsis thaliana expressing the RPS2 plant disease resistance protein. Delta79AvrRpt2 is thus a marker for type III secretion system-dependent translocation, the most critical criterion for defining type III effector proteins. We describe our screen and the collection of type III effector proteins from two pathovars of P. syringae. This stringent functional criteria defined 29 type III proteins from P. syringae pv. tomato, and 19 from P. syringae pv. phaseolicola race 6. Our data provide full functional annotation of the hrpL-dependent type III effector suites from two sequenced P. syringae pathovars and show that type III effector protein suites are highly variable in this pathogen, presumably reflecting the evolutionary selection imposed by the various host plants.


Figures

Fig. 1.
Fig. 1.
A high-throughput, FACS-based screen for P. syringae type III effector genes. (A) Diagram depicting the flow of our screen. Libraries were constructed in DFI vectors 1–3 upstream of Δ79avrRpt2::GFP3 and mobilized into Pto carrying pBAD::hrpL. Clones carrying HrpL-regulated inserts were isolated in a four-step process using FACS. Cells were first grown in modified minimal medium lacking arabinose, and the least fluorescent ≈30% of cells were collected to eliminate those constitutively expressing GFP. These ≈200,000 cells were subsequently grown in minimal medium with arabinose, and a small population of cells with the highest level of GFP expression, compared to those of a negative control population grown in the absence of arabinose, were collected by FACS (see B). These two steps were repeated, except that the GFP-positive cells were individually cloned by FACS after the second arabinose induction. DNA inserts were amplified, sequenced, and assembled. Contigs were analyzed, and full-length genes and operons were identified, cloned upstream of Δ79avrRpt2::GFP3, and tested for HrpL-induction as well as translocation of Δ79AvrRpt2 into leaves of RPS2-expressing plants. (B) Three FACS histograms from the screen for HrpL-induced genes from Pto. Histogram 1 shows distribution of GFP-fluorescence of the original library before any enrichment. The boxed area represents the region that was FACS cloned (least fluorescent 28.82% with a mean of 5.73. Histogram 2 shows distribution of GFP-fluorescence after growth in arabinose. A fluorescent population of the brightest 0.44% (mean of 227.66) of cells was sorted (compared to 0.34% and 147.24, respectively, in the same fluorescence range in uninduced controls of the same cell population). Histogram 3 shows distribution of GFP-fluorescence after all four FACS enrichment steps. The boxed area represents the region from which individual cells were FACS cloned; 4.66% with a mean of 325.50 versus 0.42% and 231.13, respectively, for the uninduced negative control. Each histogram represents at least 40,000 cells. x axis shows GFP fluorescence in log. y axis shows number of cells in each channel.
Fig. 2.
Fig. 2.
Genome context of type III effector genes in Pto and Pph6.(A) Orthologous type III effector proteins were compared by using blastx analysis of deduced Pph6 proteins against the translated sequences from Pto. Significant homologies are given as % identity (%ID), % of the proteins that aligned (% Aln) and regions of alignment; n, amino terminal, FL, full-length entire protein; C, carboxy terminal. (B) Type III effector genes are depicted along horizontal bars representing the bacterial chromosome or plasmid (black, Pto; blue, Pph6). Marks above and below the bar are the genes encoded on the top and bottom strand, respectively. Black and purple marks represent genes encoding type III effector genes and operons, respectively. Letter abbreviations correspond to the unified naming nomenclature of type III effector genes. Orthologous type III effector genes are highlighted in red. Predicted mobile elements are denoted with a red asterisks. (C) The orthologous copies of HopI1 as well as hopAB2Pto and hopAB3 occupy similar regions in their respective genomes. Flanking ORFs had >80% identity along the length of the sequence. Orthologous genes are connected by dotted red lines. Gray boxes, orthologous flanking ORFs; black bars or boxes, Pto; blue bars or boxes, Pph6; red asterisks, mobile elements.

Comment in

  • Powerful screens for bacterial virulence proteins.
    Nomura K, He SY. Nomura K, et al. Proc Natl Acad Sci U S A. 2005 Mar 8;102(10):3527-8. doi: 10.1073/pnas.0500724102. Epub 2005 Feb 28. Proc Natl Acad Sci U S A. 2005. PMID: 15738387 Free PMC article. No abstract available.

References

    1. Bogdanove, A. J., Beer, S. V., Bonas, U., Boucher, C. A., Collmer, A., Coplin, D. L., Cornelis, G. R., Huang, H. C., Hutcheson, S. W., Panopoulos, N. J., et al. (1996) Mol. Microbiol. 20, 681-683. - PubMed
    1. Hueck, C. J. (1998) Microbiol. Mol. Biol. Rev. 62, 379-433. - PMC - PubMed
    1. Lindgren, P. B., Peet, R. C. & Panapoulos, N. J. (1986) J. Bacteriol. 168, 512-522. - PMC - PubMed
    1. Dangl, J. L. & Jones, J. D. G. (2001) Nature 411, 826-833. - PubMed
    1. Xiao, Y., Heu, S., Yi, J., Lu, Y. & Hutcheson, S. W. (1994) J. Bacteriol. 176, 1025-1036. - PMC - PubMed

Publication types

MeSH terms

Substances

LinkOut - more resources