. 2005 Mar;11(3):241-7.
doi: 10.1261/rna.7240905.

Microarray profiling of microRNAs reveals frequent coexpression with neighboring miRNAs and host genes

Affiliations

Microarray profiling of microRNAs reveals frequent coexpression with neighboring miRNAs and host genes

Scott Baskerville et al. RNA. 2005 Mar.

Abstract

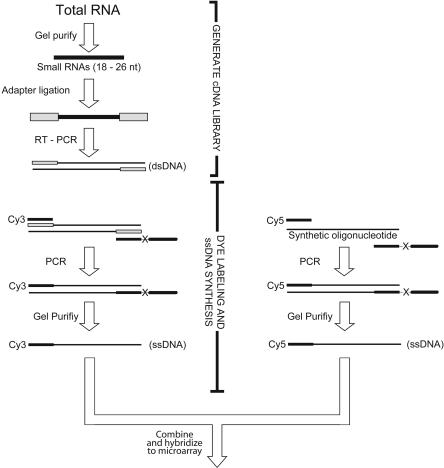
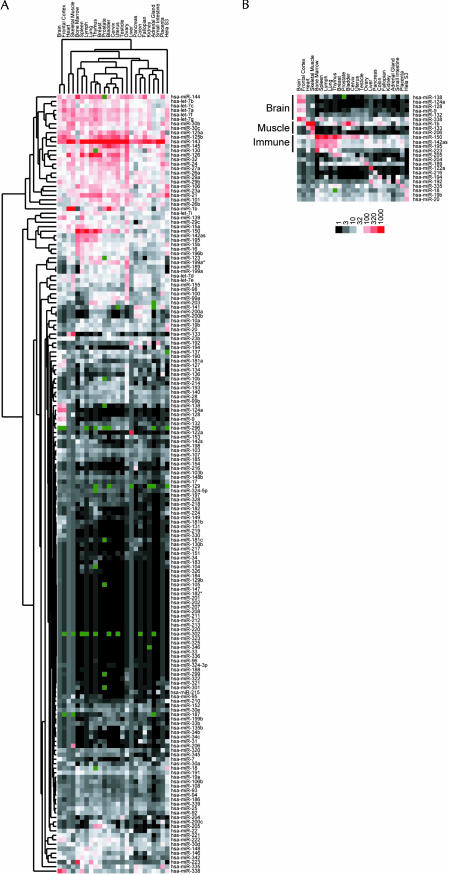
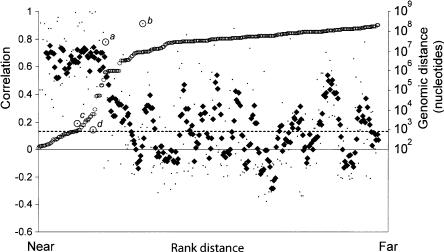
MicroRNAs (miRNAs) are short endogenous RNAs known to post-transcriptionally repress gene expression in animals and plants. A microarray profiling survey revealed the expression patterns of 175 human miRNAs across 24 different human organs. Our results show that proximal pairs of miRNAs are generally coexpressed. In addition, an abrupt transition in the correlation between pairs of expressed miRNAs occurs at a distance of 50 kb, implying that miRNAs separated by <50 kb typically derive from a common transcript. Some microRNAs are within the introns of host genes. Intronic miRNAs are usually coordinately expressed with their host gene mRNA, implying that they also generally derive from a common transcript, and that in situ analyses of host gene expression can be used to probe the spatial and temporal localization of intronic miRNAs.


Figures

FIGURE 1.
FIGURE 1.
Microarray sample preparation and reference oligonucleotide synthesis. Small RNAs were fractionated on a polyacrylamide gel, and oligonucleotide primers were then ligated to the 5′ and 3′ ends of the small RNA library (Lau et al. 2001). A cDNA library was generated through reverse transcription, and the product was amplified using PCR. Using a pair of modified oligonucleotide primers in a second PCR, the sense strand of the library was fluorescently labeled and the antisense strand was selectively lengthened (Williams and Bartel 1995). The sense strand of the asymmetric duplex was purified away from the antisense strand in a denaturing gel, and this purified dye-labeled ssDNA sample was used for hybridization and detection on the array. At each feature, the signal from the miRNA sample was compared to that from a reference sample, which had been generated by amplifying and labeling synthetic oligonucleotides using the same strategy as for the miRNA sample.
FIGURE 2.
FIGURE 2.
Hierarchical clustering of human miRNAs. (A) Colorgram depicts high (red), average (white), low (black), and absent (dark green) array scores for miRNAs. The highest score was 7095 (miR-143 in Uterus); the average score was 32. The background scores ranged between 0.4 and 3.5; for each tissue, features scoring below the background were set to the level of the background. MicroRNA scores used to generate the colorgram are reported as supplemental data (Supplementary Table 1, http://web.wi.mit.edu/bartel/pub/bartel_publications.html). (B) Examples of miRNAs preferentially expressed in specific tissues. Brain-specific miRNAs, muscle-specific miRNAs, and miRNAs associated with organs of the human immune system are highlighted.
FIGURE 3.
FIGURE 3.
Relationship between the distance separating miRNA loci and their coordinate expression in human tissues. Each of these miRNAs was paired with each of the others lying in the same orientation on the same chromosome. For each pair, the distance between the two loci was ranked, and the correlation coefficient for their expression was plotted according this rank (small points, left axis). A five-point moving average of correlation coefficients is also shown (♦), as are the distances between miRNAs in the human genome (○, right axis), and the average correlation coefficient for all the plotted pairs (dashed line). Outliers discussed in the text are annotated (a–d).

Similar articles

Cited by

References

    1. Aravin, A.A., Lagos-Quintana, M., Yalcin, A., Zavolan, M., Marks, D., Snyder, B., Gaasterland, T., Meyer, J., and Tuschl, T. 2003. The small RNA profile during Drosophila melanogaster development. Drosophila. Drosophila. Cell 5: 337–350. - PubMed
    1. Babak, T., Zhang, W., Morris, Q., Blencowe, B.J., and Hughes, T.R. 2004. Probing microRNAs with microarrays: Tissue specificity and functional inference. RNA 10: 1813–1819. - PMC - PubMed
    1. Baker, S.J., Sumerson, R., Reddy, C.D., Berrebi, A.S., Flynn, D.C., and Reddy, E.P. 2001. Characterization of an alternatively spliced AATYK mRNA: Expression pattern of AATYK in the brain and neuronal cells. Oncogene 20: 1015–1021. - PubMed
    1. Bartel, D.P. 2004. MicroRNAs: Genomics, biogenesis, mechanism, and function. Cell 116: 281–297. - PubMed
    1. Brennecke, J., Hipfner, D.R., Stark, A., Russell, R.B., and Cohen, S.M. 2003. bantam encodes a developmentally regulated microRNA that controls cell proliferation and regulates the proapoptotic gene hid in Drosophila. Cell 113: 25–36. - PubMed

Publication types

LinkOut - more resources