Comparative Study
. 2005 Feb 9;25(6):1375-86.
doi: 10.1523/JNEUROSCI.3902-04.2005.

Frontal lobe inputs to the digit representations of the motor areas on the lateral surface of the hemisphere

Affiliations
Comparative Study

Frontal lobe inputs to the digit representations of the motor areas on the lateral surface of the hemisphere

Richard P Dum et al. J Neurosci. .

Abstract

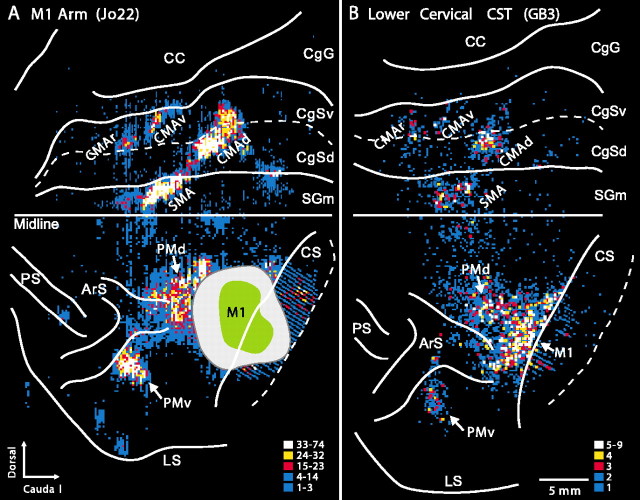
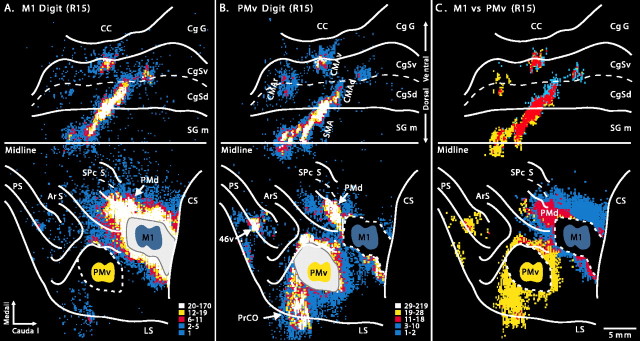
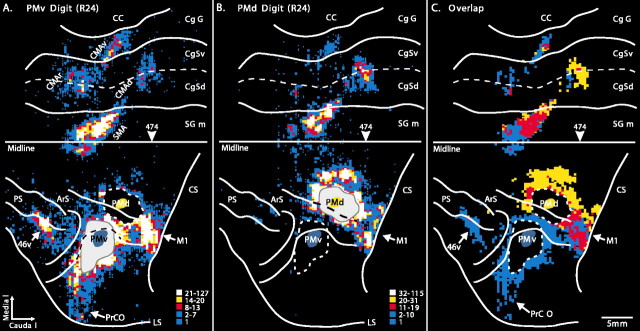
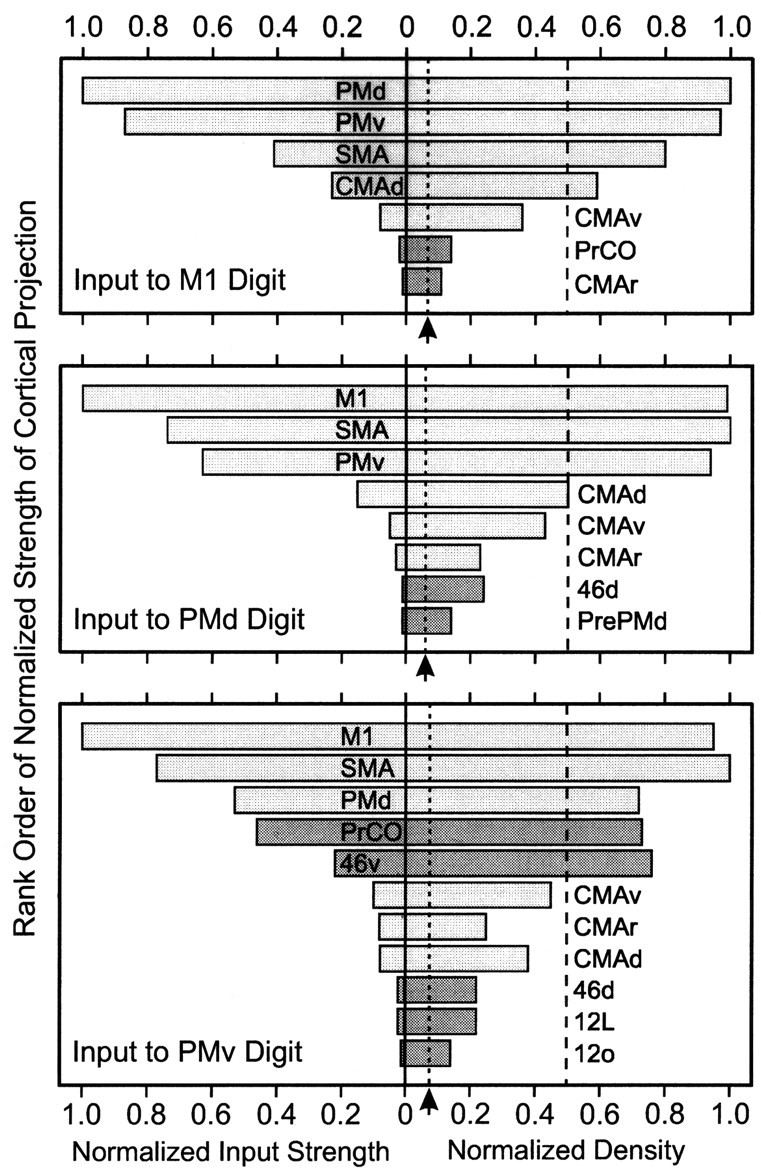
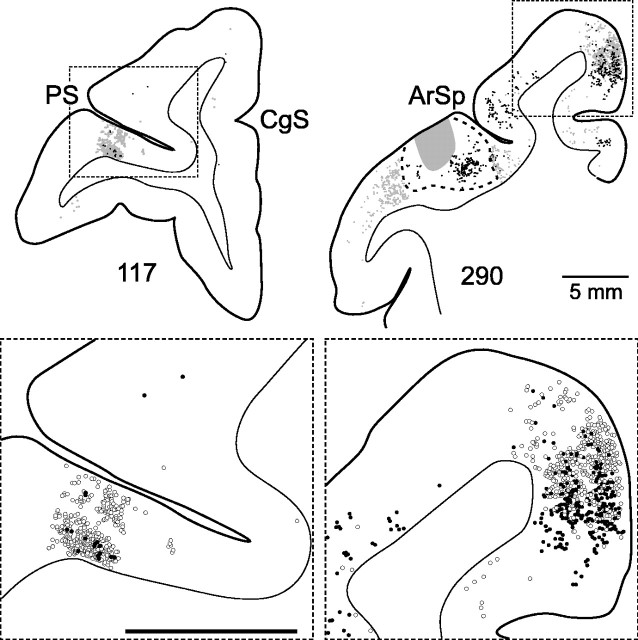
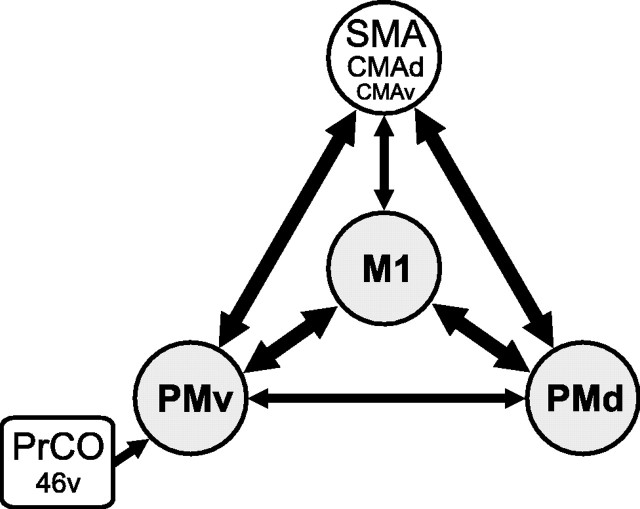
We examined the frontal lobe connections of the digit representations in the primary motor cortex (M1), the dorsal premotor area (PMd), and the ventral premotor area (PMv) of cebus monkeys. All of these digit representations lie on the lateral surface of the hemisphere. We used intracortical stimulation to identify the digit representations physiologically, and then we injected different tracers into two of the three cortical areas. This approach enabled us to compare the inputs to two digit representations in the same animal. We found that the densest inputs from the premotor areas to the digit representation in M1 originate from the PMd and the PMv. Both of these premotor areas contain a distinct digit representation, and the two digit representations are densely interconnected. Surprisingly, the projections from the digit representation in the supplementary motor area (SMA) to the PMd and PMv are stronger than the SMA projections to M1. The projections from other premotor areas to M1, the PMd, and the PMv are more modest. Of the three digit areas on the lateral surface, only the PMv receives dense input from the prefrontal cortex. Based on these results, we believe that M1, the PMd, and the PMv form a densely interconnected network of cortical areas that is concerned with the generation and control of hand movements. Overall, the laminar origins of neurons that interconnect the three cortical areas are typical of "lateral" interactions. Thus, from an anatomical perspective, this cortical network lacks a clear hierarchical organization.


Figures

Figure 1.
Figure 1.
Localization of cortical injection sites. The digit representations of M1, the PMd, and the PMv were mapped using intracortical stimulation. Then, we injected FB into one digit representation and DY into another digit representation. A, The dashed box on a cebus monkey brain delineates the region magnified in B-D. B, Animal R12 with injection sites in the PMd and M1. The injection site outlines indicate the extent of zones 1 and 2 (see Materials and Methods for additional details). The symbols indicate the movement evoked at each site and its threshold (large, <5 μA; medium, 5-10 μA; small, >10 μA). C, Animal R15 with injection sites in the PMv and M1. D, Animal R24 with injection sites in the PMd and PMv. ArS, Arcuate sulcus; CS, central sulcus; IPS, intraparietal sulcus; LS, lateral sulcus; PS, principal sulcus.
Figure 2.
Figure 2.
Six premotor areas in the frontal lobe of the cebus monkey. A, Projections to M1. The unfolded map of the frontal lobe depicts the density of neurons labeled after WGA-HRP injections into the arm representation of M1 (see Materials and Methods) (Dum and Strick, 1991b). The extent of tracer spread at the injection site is delineated by green shading, and the surrounding region where labeled neurons were too dense to plot is indicated by gray shading. The medial wall is unfolded and reflected upward from the midline. The lip of each sulcus is represented by a solid line, and its fundus is indicated by a dashed line. The density of labeled neurons was determined by counting the number of labeled cells within 200 μm bins along every fourth section. The number of cells per bin was divided into five levels and color-coded: white, top 5% of bins (95-100%); yellow, 90-95%; red, 80-90%; large blue squares, 40-80%; small blue squares, 0-40%. B, Projections to the spinal cord. The unfolded map of the frontal lobe depicts the density of neurons labeled after fluorescent tracer injections into the lower cervical segments (C7-T1) of the spinal cord. Each of the six premotor areas shown in A projects to the spinal cord. The number of cells per bin was divided into five levels and color-coded as described above. CC, Corpus callosum; CgSd, dorsal bank of the cingulate sulcus; CgSv, ventral bank of the cingulate sulcus; CgG, cingulate gyrus; SGm, medial portion of the superior frontal gyrus. Other abbreviations and conventions are as in Figure 1.
Figure 3.
Figure 3.
Frontal lobe input to the digit representations of M1 and PMd (R12). A, Location and density of neurons labeled after DY injections into the digit representation of M1. Yellow shading around the injection site in M1 indicates zones 1 and 2 of the spread of the DY. The region surrounding the injection sites where neurons were too dense to plot is indicated by gray shading. B, Location and density of neurons labeled in the frontal lobe after FB injections into the digit representation of the PMd. Blue shading around the injection site in the PMd indicates zones 1 and 2 of the spread of FB. C, Overlap of the input to the digit representations of the PMd and M1. Red shading (overlap bins) indicates bins that have a high density of cells projecting to each injection site. Yellow shading represents bins that have a high density of cells projecting to M1. Blue shading represents bins that have a high density of cells projecting to the PMd. See Materials and Methods for additional details. Abbreviations and conventions are as in Figures 1 and 2.
Figure 4.
Figure 4.
Frontal lobe input to the digit representations of M1 and the PMv (R15). A, Location and density of neurons labeled after FB injections into the digit representation of M1. B, Location and density of neurons labeled after DY injections into the digit representation of the PMv. C, Overlap of the input to the digit representations of the PMv and M1. Red shading (overlap bins) indicates bins that have a high density of cells projecting to each injection site. Blue shading represents bins that have a high density of cells projecting to M1. Yellow shading represents bins that have a high density of cells projecting to the PMv. Abbreviations and conventions are as in Figures 1 and 2.
Figure 5.
Figure 5.
Frontal lobe input to the digit representations of the PMd and PMv (R24). A, Location and density of neurons labeled after FB injections into the digit representation of the PMv. B, Location and density of neurons labeled after DY injections into the digit representation of the PMd. C, Overlap of the input to the PMd and PMv. Red shading (overlap bins) indicates bins that have a high density of cells projecting to each injection site. Blue shading represents bins that have a high density of cells projecting to PMv. Yellow shading represents bins that have a high density of cells projecting to the PMd. Abbreviations and conventions are as in Figures 1, 2, 3, 4.
Figure 6.
Figure 6.
Normalized strength and density of input from cortical areas in the frontal lobe to the digit representations of M1, the PMd, and the PMv. The strength (numbers of labeled neurons in an area) and density (average number of labeled neurons per bin in an area) were normalized to the cortical area with the most labeled cells or the highest density. The minimum relative strength included equals 0.01. The lowest possible value for the normalized density (equivalent of 1 cell per bin) is indicated (dashed line marked by arrow). Light shading indicates cortical motor areas. Dark shading indicates prefrontal areas.
Figure 7.
Figure 7.
M1 neurons that project to the PMd (black circles) or to the PMv (open circles). The region enclosed by the dashed box on the left is enlarged on the right. Double-labeled neurons (gray circles) are indicated only in the enlargement. Note the intermingling of the two types of neurons and their common laminar origin. The level of this section is marked in Figure 5. CgS, Cingulate sulcus; CS, central sulcus.
Figure 8.
Figure 8.
Prefrontal and SMA neurons that project to the digit representations of the motor areas on the lateral surface. Left, Labeled neurons in area 46 that project to the PMv (open circles) or to M1 (filled circles) are plotted on a coronal section through the caudal third of the principal sulcus (R15). Right, Labeled neurons in the SMA that project to the PMv (open circles) or to the PMd (filled circles) are plotted on a coronal section located just caudal to the genu of the arcuate sulcus (R24). The FB injection site in the PMv is delineated by gray shading, and the surrounding region of intensely labeled neurons is delineated by the dotted line. CgS, Cingulate sulcus; PS, principal sulcus; ArSp, spur of the arcuate sulcus. Calibration, 5 mm.
Figure 9.
Figure 9.
The laminar origin of cortical inputs to the digit representations in M1, the PMd, and the PMv. Deep connections are those in which labeled neurons located in deep layers (V-VI) are at least twice as numerous as those in superficial layers (II-III). Equal connections are those in which the number of neurons in superficial and deep layers are equivalent. Super connections are those in which neurons located in superficial layers are at least twice as numerous as those in deep layers. The shaded bars indicate cortical areas that have dense projections (normalized density of ≥0.5 in Fig. 6) to the injected motor area. See Results for details. Abbreviations are as in Figures 1 and 4.
Figure 10.
Figure 10.
Frontal lobe network for hand movements. The size of the arrows indicates the relative strength of an input. Shaded circles indicate motor areas on the lateral surface. Un-shaded circles are motor areas on the medial wall. The square indicates prefrontal areas of the cortex. Abbreviations are as in Figures 1 and 4.

Similar articles

Cited by

References

    1. Aizawa H, Inase M, Mushiake H, Shima K, Tanji J (1991) Reorganization of activity in the supplementary motor area associated with motor learning and functional recovery. Exp Brain Res 84: 668-671. - PubMed
    1. Arikuni T, Sakai M, Hamada I, Kubota K (1980) Topographical projections from the prefrontal cortex to the post-arcuate area in the rhesus monkey, studied by retrograde axonal transport of horseradish peroxidase. Neurosci Lett 19: 155-160. - PubMed
    1. Barbas H, Mesulam MM (1985) Cortical afferent input to the principalis region of the rhesus monkey. Neuroscience 15: 619-637. - PubMed
    1. Barbas H, Pandya DN (1987) Architecture and frontal cortical connections of the premotor cortex (area 6) in the rhesus monkey. J Comp Neurol 256: 211-228. - PubMed
    1. Barone P, Batardiere A, Knoblauch K, Kennedy H (2000) Laminar distribution of neurons in extrastriate areas projecting to visual areas V1 and V4 correlates with the hierarchical rank and indicates the operation of a distance rule. J Neurosci 20: 3263-3281. - PMC - PubMed

Publication types

Substances

LinkOut - more resources