. 2005 Feb 9;25(6):1503-13.
doi: 10.1523/JNEUROSCI.4007-04.2005.

Representation of tone in fluctuating maskers in the ascending auditory system

Affiliations

Representation of tone in fluctuating maskers in the ascending auditory system

Liora Las et al. J Neurosci. .

Abstract

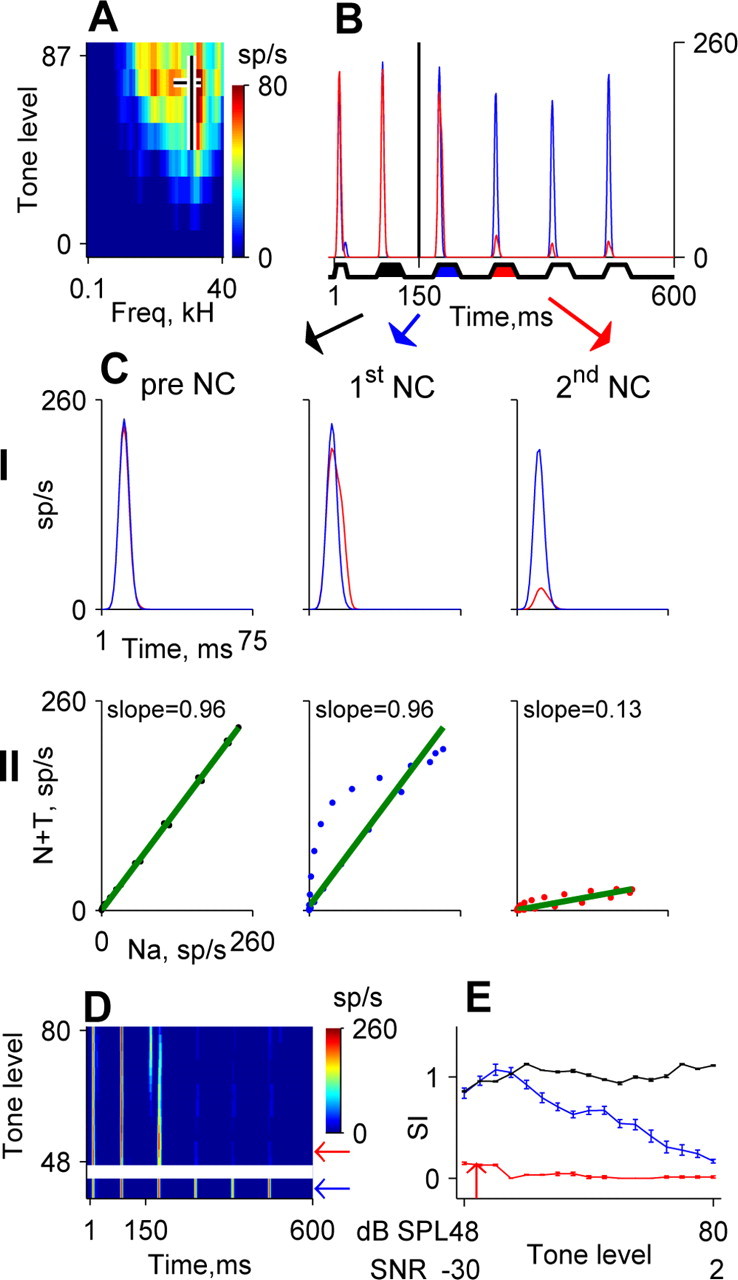
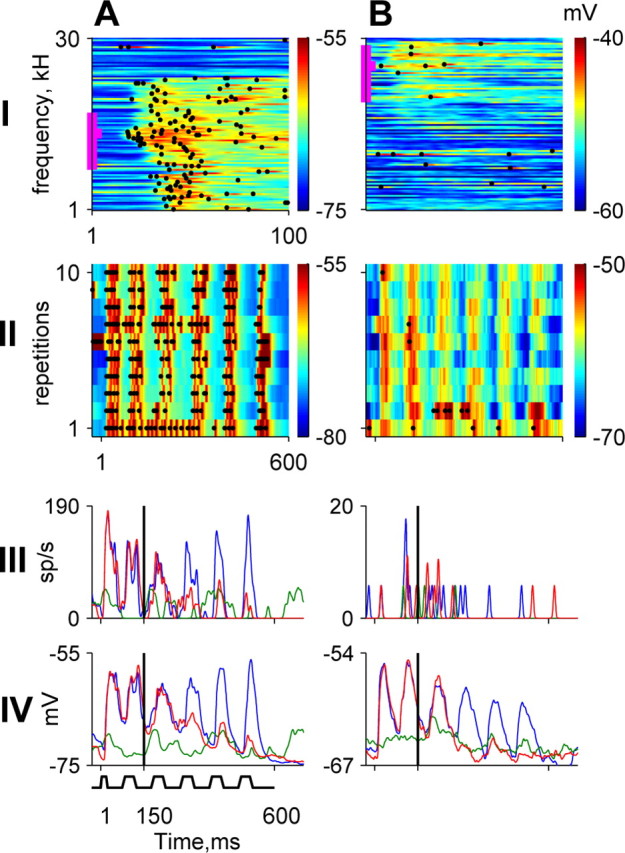
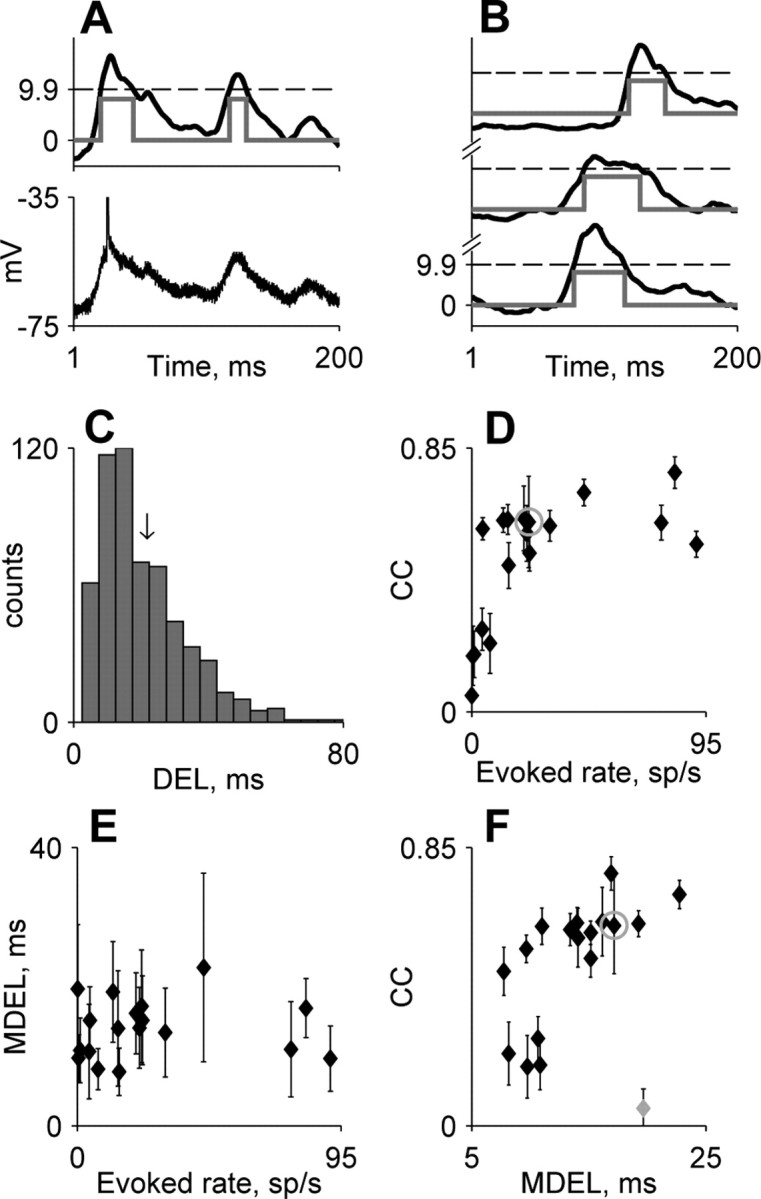
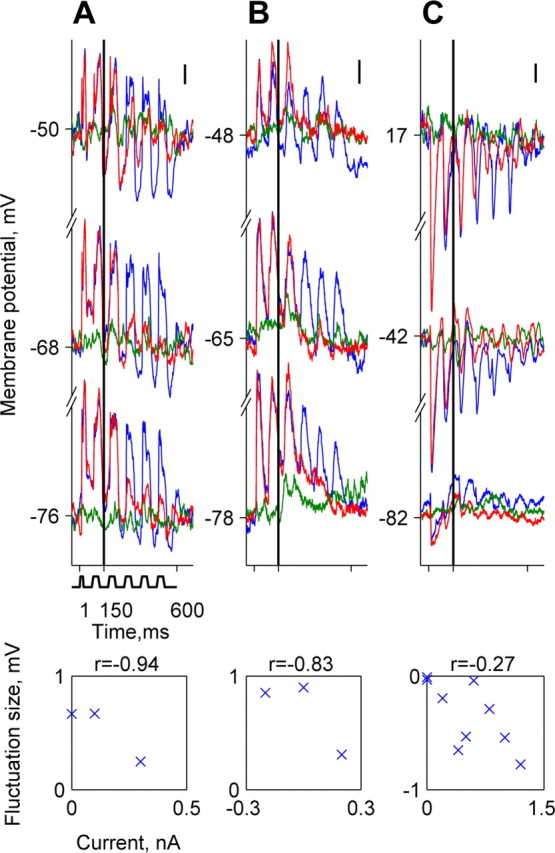
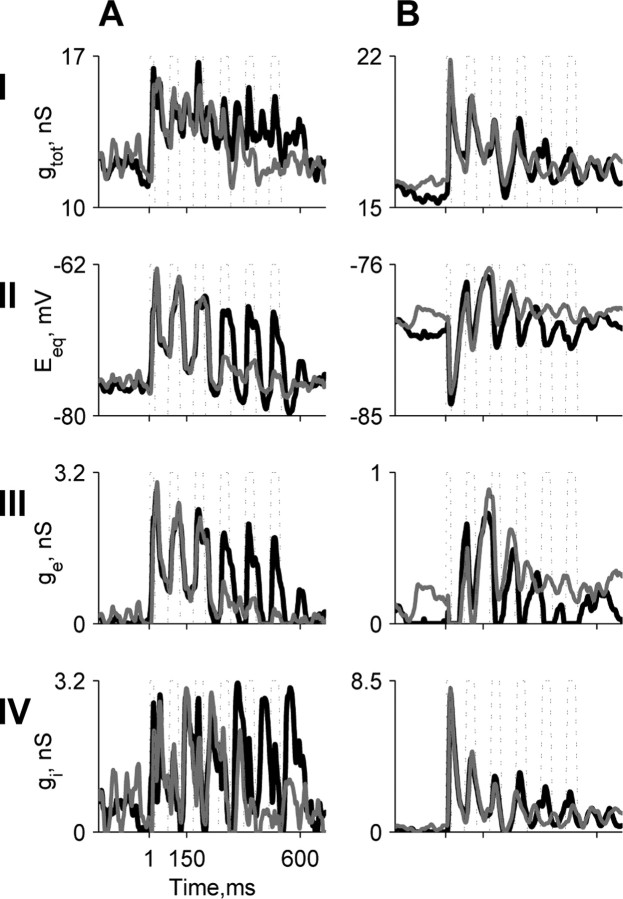
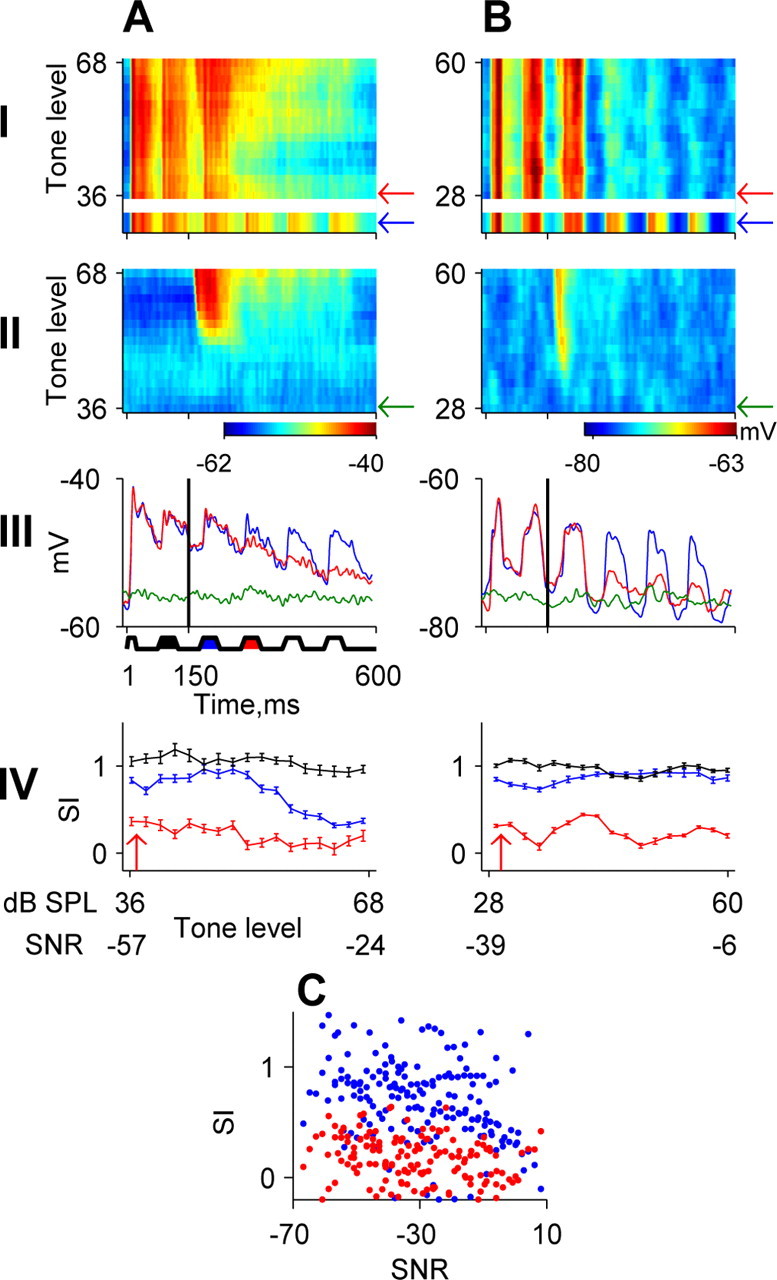
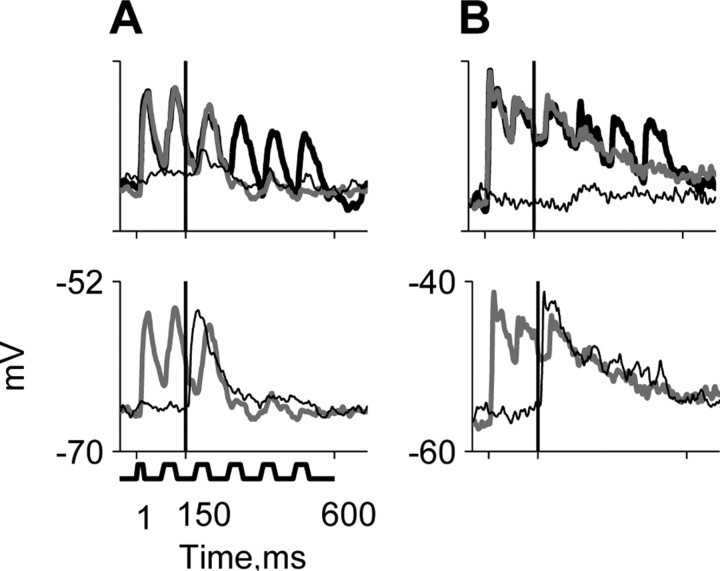
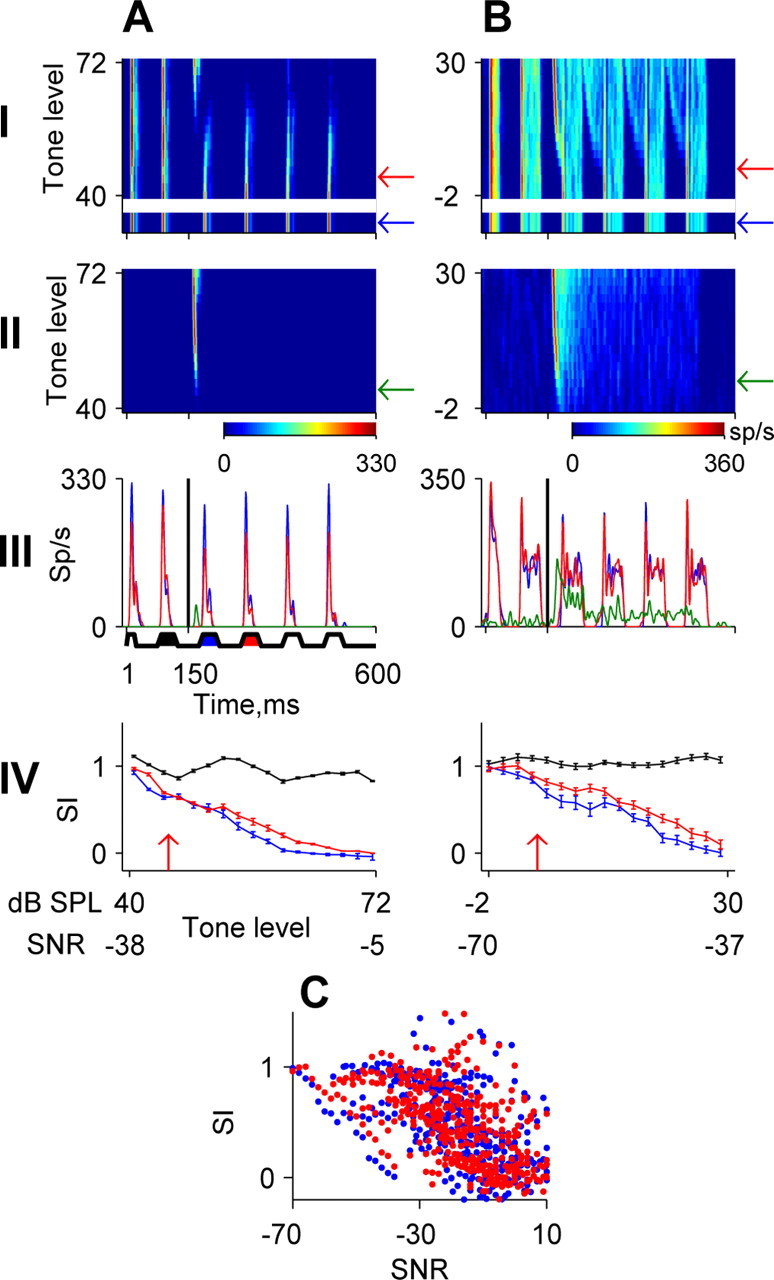
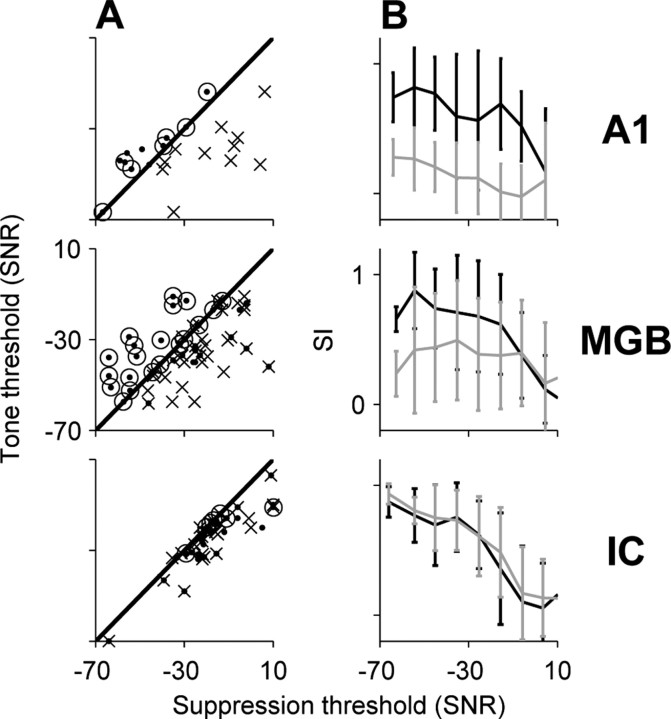
Humans and animals detect low-level tones masked by slowly fluctuating noise very efficiently. A possible neuronal correlate of this phenomenon is the ability of low-level tones to suppress neuronal locking to the envelope of the fluctuating noise ("locking suppression"). Using in vivo intracellular and extracellular recordings in cats, we studied neuronal responses to combinations of fluctuating noise and tones in three successive auditory stations: inferior colliculus (IC), medial geniculate body (MGB), and primary auditory cortex (A1). We found that although the most sensitive responses in the IC were approximately isomorphic to the physical structure of the sounds, with only a small perturbation in the responses to the fluctuating noise after the addition of low-level tones, some neurons in the MGB and all A1 neurons displayed striking suppressive effects. These neurons were hypersensitive, showing suppression already with tone levels lower than the threshold of the neurons in silence. The hypersensitive locking suppression in A1 and MGB had a special timing structure, starting >75 ms after tone onset. Our findings show a qualitative change in the representation of tone in fluctuating noise along the IC-MGB-A1 axis, suggesting the gradual segregation of signal from noise and the representation of the signal as a separate perceptual object in A1.


Figures

Figure 1.
Figure 1.
Quantification of locking suppression. A, The FRA (color coded) of a neuron in MGB. The horizontal black line indicates the bandwidth of the modulated noise that was used, and it is plotted at the level of the tones with the same energy, corresponding to SNR = 0. The vertical black line indicates the BF and is plotted over the range of levels that was used to test this neuron. B, Averaged response to the noise alone (blue line) and to the noise plus tone stimulus at the minimal tone level tested (red line). Tone onset is indicated by a vertical tick at 150 ms. Noise envelope is represented schematically at the bottom. The black, blue, and red patches indicate the noise cycle preceding tone onset and the first and second NCs after tone onset, respectively. C, Calculation of the SI. Row I shows 75 ms segments of the responses to the noise alone and noise plus tone stimuli for the three noise cycles (see Materials and Methods). Row II plots the two response segments from row I against each other. The slope of the scatter plot quantifies the effect of the added tone (same color conventions as in B). D, Average responses to amplitude-modulated noise alone (indicated by the blue arrow) and to tone plus noise combinations at different tone levels (presented as a response plane). Tone level is expressed in dB SPL. The red arrow indicates the minimal tone level at which suppression was observed. Tone onset is indicated by a vertical tick at 150 ms. E, SI as a function of tone level and SNR (relative to total noise energy in dB) for the three NCs (same colors as in B).
Figure 2.
Figure 2.
Morphology and spontaneous activity of A1 neuron. A, A biocytin-filled pyramidal neuron. Scale bar, 100 μm. B, A section of its dendritic arborization, with dendritic spines clearly observable (arrows). Scale bar, 20 μm. C, Spontaneous membrane potential activity of the neuron. Resting potential is -75 mV (arrow). Calibration: 20 mV, 200 ms.
Figure 3.
Figure 3.
Responses of two A1 neurons (A, B) to tones and modulated noise. Each panel in row I and row II depicts the subthreshold responses in color, whereas the spikes are represented by black dots. Row I, Response to pure tones of 100 different frequencies presented at a constant tone level. BFs and tone levels: A, 4.5 kHz and 66 dB SPL; B, 17 kHz and 68 dB SPL. The bandwidth of the fluctuating masker is indicated by the vertical thick magenta line. Row II, Ten individual responses to the fluctuating maskers. The total noise energy was 90 and 70 dB SPL for A and B, respectively. Rows III and IV, Average spike and membrane potential responses to the noise plus tone stimulus at the minimal tone level tested (red), to the tone alone at the same level (green), and to the noise alone (blue).
Figure 4.
Figure 4.
Population analysis of the relationship between subthreshold and spike responses. A, A segment of ongoing activity containing two depolarizing excursions. The bottom panel displays the original, unsmoothed 200 ms segment of membrane potential. The top panel displays the smoothed membrane potential after subtraction of Vrest. The dashed line indicates the threshold in the definition of the depolarizing excursions. The duration of the depolarizing excursion is indicated by the gray line. B, Three additional examples of depolarizing excursions from the same neuron. C, The distribution of depolarizing excursion length for the same neuron as in A and B. The black arrow indicates the MDEL (17 ms) for this neuron. D, Evoked spike rate versus CC for all neurons (n = 18). E, Evoked spike rate versus MDEL for all neurons. F, MDEL versus CC. In D and F, the error bars represent SDs over all data files of each neuron, whereas in E, error bars represent the interquartile range of the distribution of the depolarizing excursions for each neuron. Gray circles in D-F mark the neuron from A-C.
Figure 7.
Figure 7.
Membrane potential responses of A1 neurons during current injection. A-C, Responses of three neurons. B is the same neuron as in Figure 5A. Each panel depicts the responses to a low-level tone plus noise combination (red), the responses to tone alone at the same level (green), and responses to noise alone (blue). These are shown at three current injection levels. The scatter plots show the mean fluctuation size as a function of current level for all current levels used to test each of the three neurons. The correlation coefficient r is displayed above the scatter plot. A, Currents (nA; from bottom to top): 0, 0.1, 0.3; BF, 20 kHz; SNR, -32 dB. B, Currents (nA; from bottom to top): -0.2, 0, 0.2; BF, 17 kHz; SNR, -23 dB. C, Currents (nA; from bottom to top): 0, 0.6, 1.2; BF, 3 kHz; SNR, -32 dB. Scale bars, 2 mV.
Figure 8.
Figure 8.
Suppression of the locking of the excitatory and inhibitory conductances to the noise envelope by low-level tones in A1 neurons. A is the same neuron as in Figure 7A, and B is the same neuron as in Figure 7C. Each panel shows the changes during noise alone (black) and noise plus tone representation (gray). Row I, Total conductance, gtot. Row II, Equivalent reversal potential, Eeq. Row III, Excitatory conductance, ge. Row IV, Inhibitory conductance, gi.
Figure 5.
Figure 5.
Locking suppression in A1. A, B, Membrane potential responses of two A1 neurons. Row I, Responses to noise alone and noise plus tone (same layout as in Fig. 1 D). Row II, Average responses to tone alone at the same levels as in row I. The green arrows indicate the response to the tone alone at the minimal level inducing suppression. Row III, Response to the noise plus tone stimulus at the level indicated by the red arrow in row I (red), response to tone alone at the same level (green), and response to noise alone (blue). Row IV, SI as a function of tone level and SNR (same layout as in Fig. 1 E). C, Population analysis of similarity indices at the first (blue) and second NCs (red) as a function of SNR. Each dot represents the similarity indices of one neuron at one SNR value for all neurons that exhibited significant envelope locking (n = 11). The points arising from the responses of the same neuron are not connected to reduce the clutter in the figure. Note the large differences between the similarity indices to the first and second NCs at low SNRs, demonstrating the hypersensitive locking suppression in A1 neurons.
Figure 6.
Figure 6.
Responses to near-threshold tones in noise are similar to the responses to suprathreshold tones in silence. A, B, Responses of two neurons. B is the same neuron as in Figure 5A. The top panels depict the responses to noise alone (thick black line), to a noise plus tone combination at the minimal tone level tested (gray line), and to the same tone level when presented alone (thin black line). The bottom panels depict the responses to a tone plus noise at the minimal tone level tested (gray, same as in top panel) and the response to a suprathreshold level that saturated the tone response (thin black line). Parameters [BF (kHz): low-tone level, and high-tone level in SNR, low-tone level and high-tone level in dB SPL]: A, 29, 3, 41, 73; B, 15, -57, -25, 36, 68.
Figure 9.
Figure 9.
Locking suppression of spiking responses in MGB. The same layout as in Figure 5, A and B, is used. Responses of two MGB neurons are shown. C, Population analysis of SIs; data are from 37 neurons.
Figure 10.
Figure 10.
Locking suppression of spiking responses in IC. The same layout as in Figure 5, A and B, is used. Responses of two IC neurons are shown. C, Population analysis of SIs; data are from 29 neurons.
Figure 11.
Figure 11.
Comparisons between responses in IC, MGB, and A1. A, Tone thresholds in silence (in SNR relative to the masker energy used for the same neuron) as a function of the suppression threshold, defined as the minimal SNR at which suppression of the first (crosses) and second (dots) NCs after tone onset was observed. Dots above the diagonal correspond to suppression thresholds below tone thresholds in silence. Black circles depict neurons in which the lowest tone level tested suppressed their envelope locking. B, Mean SI as a function of SNR for the first (black) and second (gray) NCs in the three auditory stations.

Similar articles

Cited by

References

    1. Azouz R, Gray CM (1999) Cellular mechanisms contributing to response variability of cortical neurons in vivo J Neurosci 19: 2209-2223. - PMC - PubMed
    1. Bajo VM, Rouiller EM, Welker E, Clarke S, Villa AE, de Ribaupierre Y, de Ribaupierre F (1995) Morphology and spatial distribution of corticothalamic terminals originating from the cat auditory cortex. Hear Res 83: 161-174. - PubMed
    1. Bar-Yosef O, Rotman Y, Nelken I (2002) Responses of neurons in cat primary auditory cortex to bird chirps: effects of temporal and spectral context. J Neurosci 22: 8619-8632. - PMC - PubMed
    1. Borg-Graham LJ, Monier C, Fregnac Y (1998) Visual input evokes transient and strong shunting inhibition in visual cortical neurons. Nature 393: 369-373. - PubMed
    1. Bringuier V, Chavane F, Glaeser L, Fregnac Y (1999) Horizontal propagation of visual activity in the synaptic integration field of area 17 neurons. Science 283: 695-699. - PubMed

Publication types

LinkOut - more resources