. 2005 Feb 9;25(6):1514-22.
doi: 10.1523/JNEUROSCI.4397-04.2005.

Feeding cues alter clock gene oscillations and photic responses in the suprachiasmatic nuclei of mice exposed to a light/dark cycle

Affiliations

Feeding cues alter clock gene oscillations and photic responses in the suprachiasmatic nuclei of mice exposed to a light/dark cycle

Jorge Mendoza et al. J Neurosci. .

Abstract

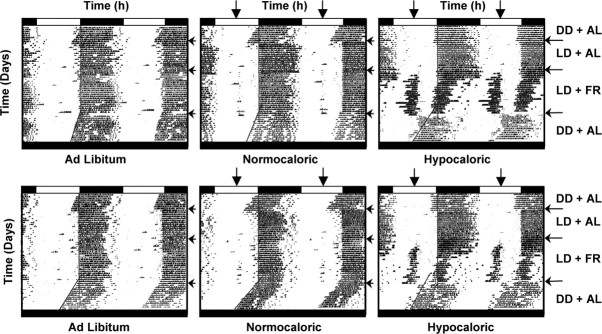
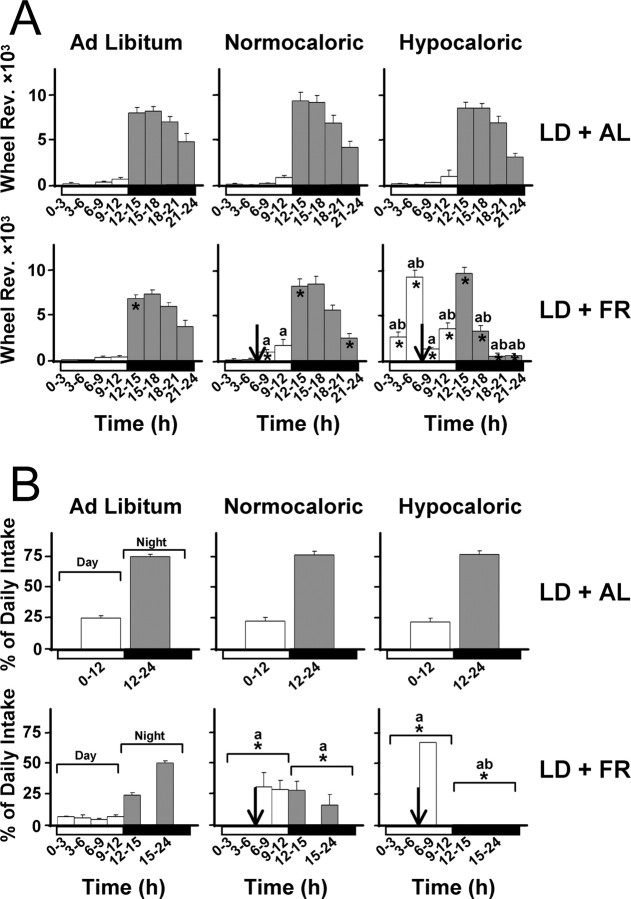
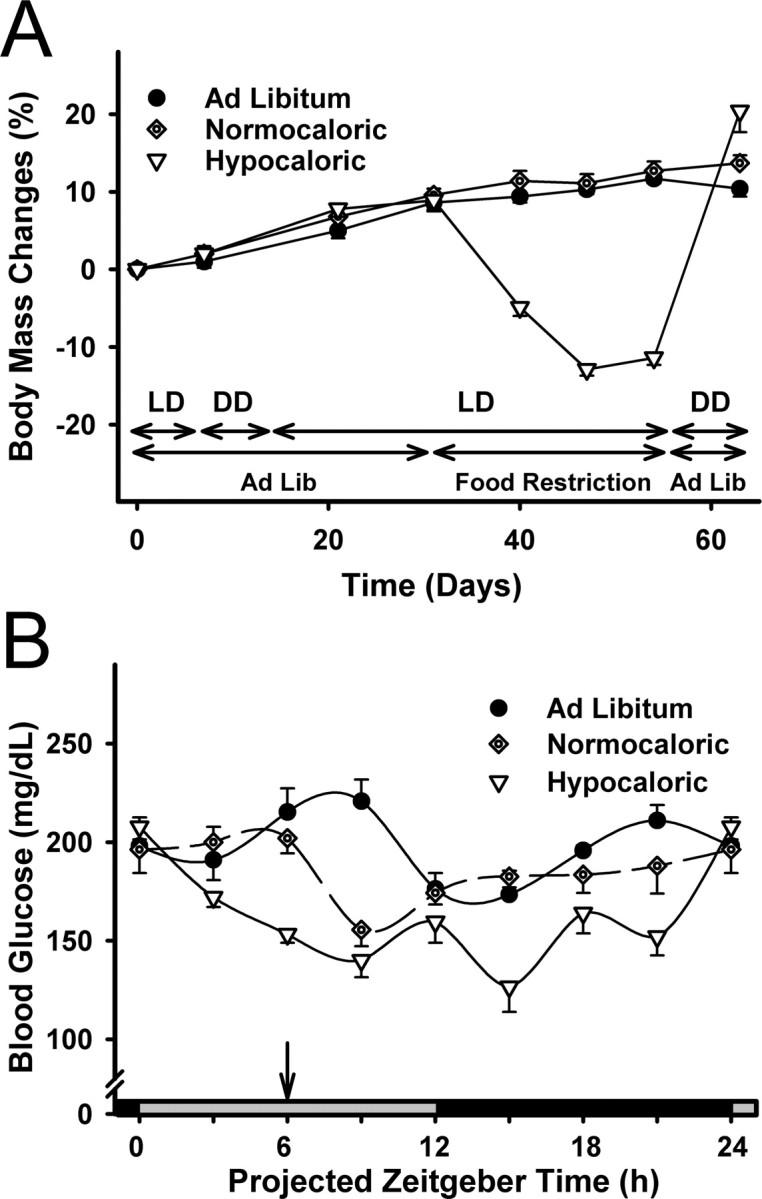
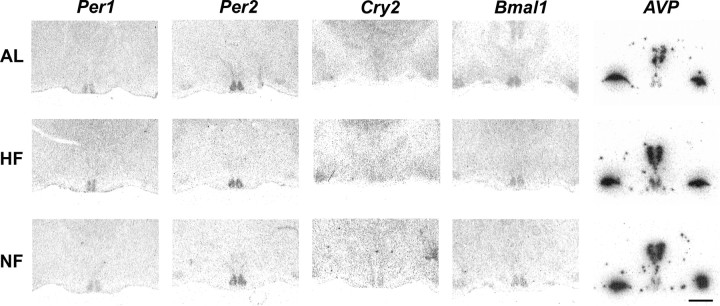
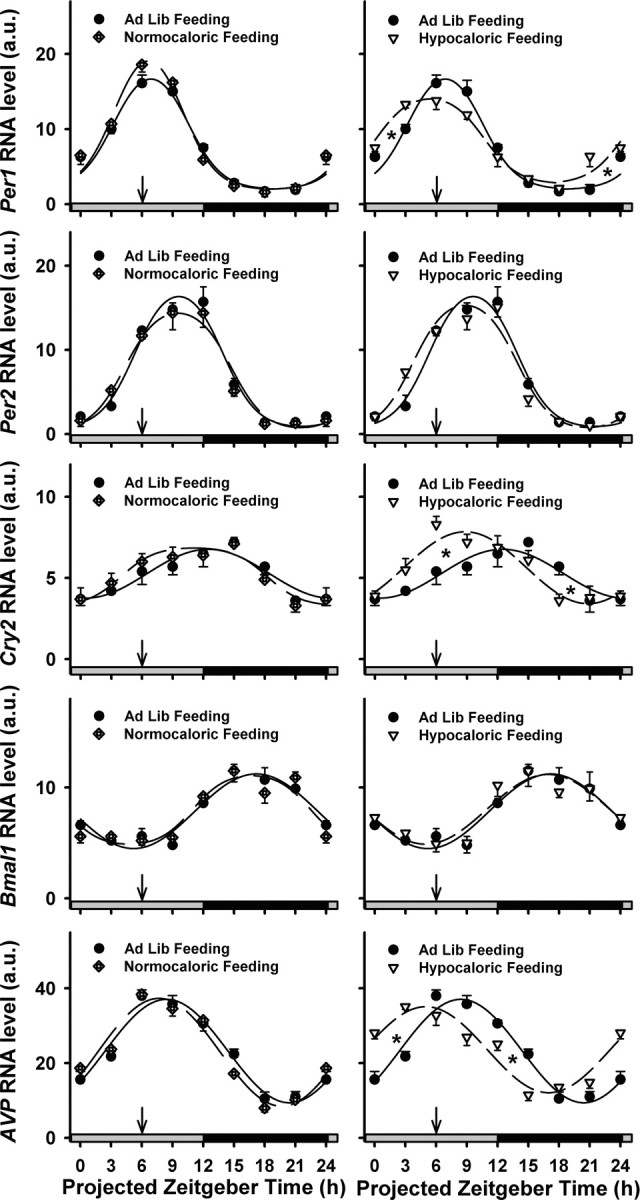
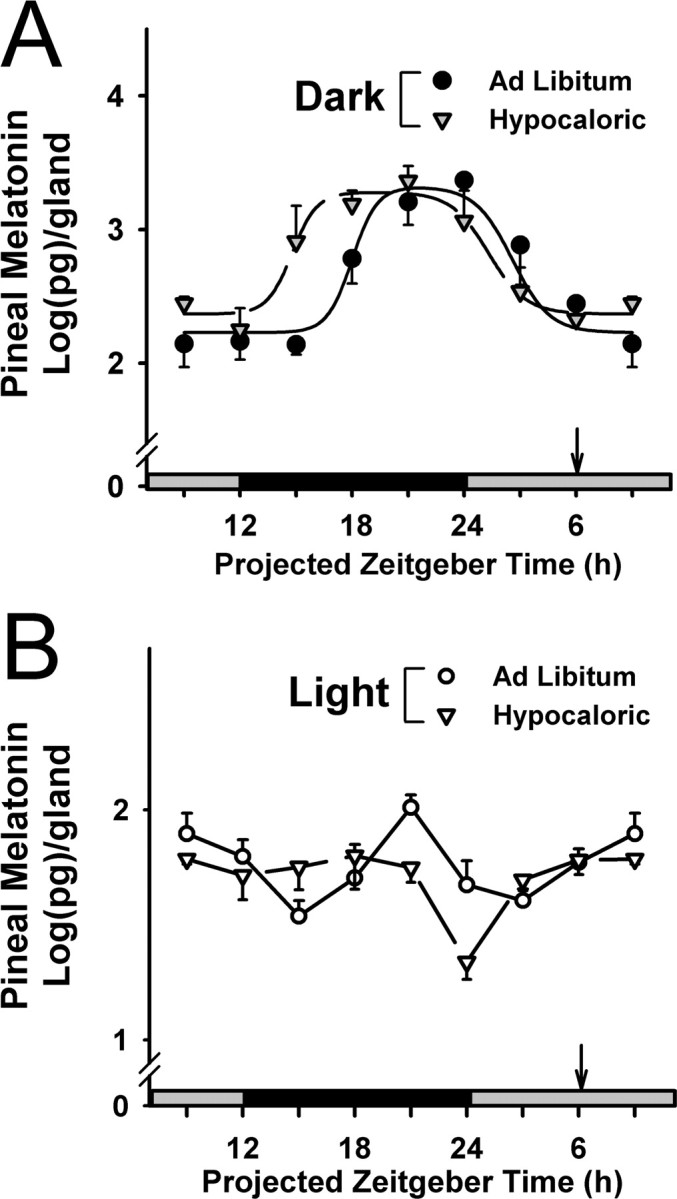
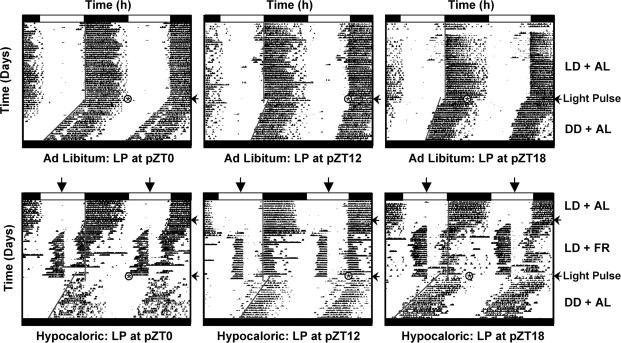
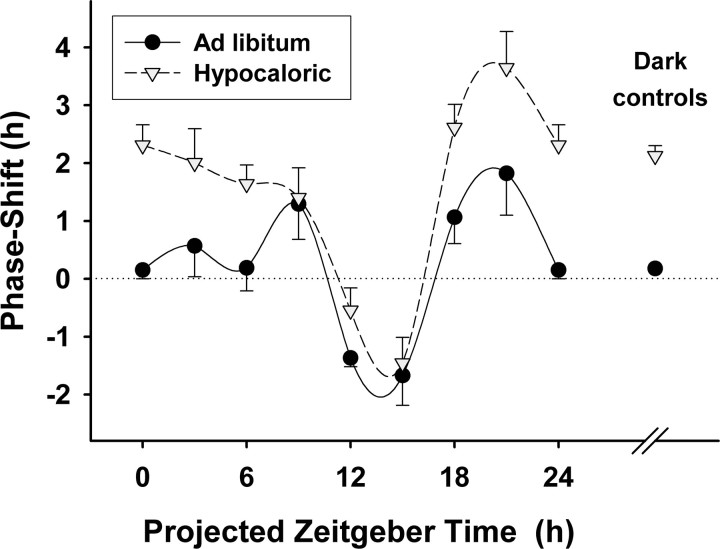
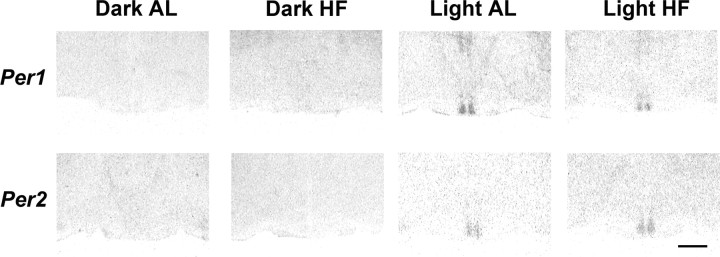
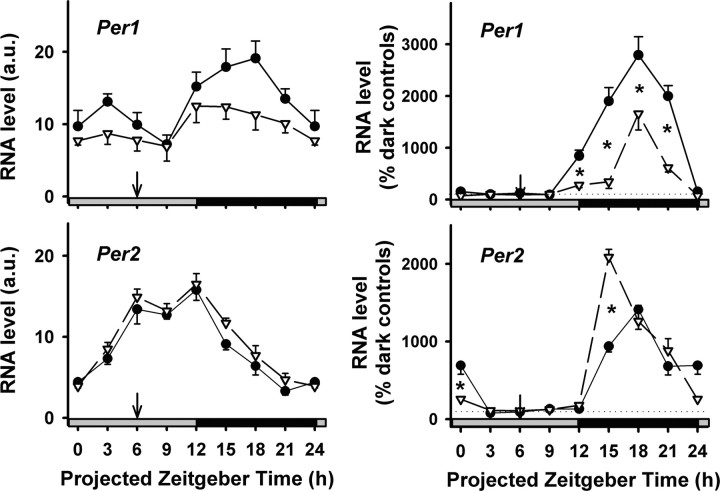
The suprachiasmatic nuclei (SCN) of the hypothalamus contain the master mammalian circadian clock, which is mainly reset by light. Temporal restricted feeding, a potent synchronizer of peripheral oscillators, has only weak influence on light-entrained rhythms via the SCN, unless restricted feeding is coupled with calorie restriction, thereby altering phase angle of photic synchronization. Effects of daytime restricted feeding were investigated on the mouse circadian system. Normocaloric feeding at midday led to a predominantly diurnal (60%) food intake and decreased blood glucose in the afternoon, but it did not affect the phase of locomotor activity rhythm or vasopressin expression in the SCN. In contrast, hypocaloric feeding at midday led to 2-4 h phase advances of three circadian outputs, locomotor activity rhythm, pineal melatonin, and vasopressin mRNA cycle in the SCN, and it decreased daily levels of blood glucose. Furthermore, Per1 and Cry2 oscillations in the SCN were phase advanced by 1 and 3 h, respectively, in hypocalorie- but not in normocalorie-fed mice. The phase of Per2 and Bmal1 expression remained unchanged regardless of feeding condition. Moreover, the shape of behavioral phase-response curve to light and light-induced expression of Per1 in the SCN were markedly modified in hypocalorie-fed mice compared with animals fed ad libitum. The present study shows that diurnal hypocaloric feeding affects not only the temporal organization of the SCN clockwork and circadian outputs in mice under light/dark cycle but also photic responses of the circadian system, thus indicating that energy metabolism modulates circadian rhythmicity and gating of photic inputs in mammals.


Figures

Figure 1.
Figure 1.
Daily wheel-running activity in two ad libitum-fed mice (left column), two normocalorie-fed mice (middle column), and two hypocalorie-fed mice (right column). First period (1 week) in constant darkness and ad libitum feeding (DD + AL); second period (2 weeks) in light/dark cycle and ad libitum feeding (LD + AL); third period (3 weeks) in light/dark cycle and food restriction (LD + FR); and fourth period (2 weeks) in constant darkness and ad libitum feeding (DD + AL). Successive 24 h periods are double plotted (48 h horizontal time scale). Nighttime, when mice were housed under light/dark conditions, is indicated by black bar on top abscissa. Time of feeding during food restriction is indicated by a vertical arrow 6 h after lights on. AL, Ad libitum feeding; DD, constant darkness; FR, food restriction; LD, light/dark cycle.
Figure 2.
Figure 2.
A, Daily pattern of wheel-running activity during the last 8 d in light/dark cycle and ad libitum feeding (LD + AL; top row) and during the last 8 d in light/dark cycle and food restriction (LD + FR; bottom row). Wheel-running activity is presented as cumulated wheel revolutions (Rev.) during 3 h intervals. *p < 0.05 in bouts of activity for a given nutritional status between LD + AL and LD + FR; a,bp < 0.05 in activity bouts in hypocalorie-fed or normocalorie-fed mice compared with ad libitum-fed mice and in hypocalorie-fed versus normocalorie-fed mice, respectively. Nighttime is indicated by a black bar on abscissa. Time of hypocaloric and normocaloric feeding is indicated by a vertical arrow 6 h after lights on. Means ± SEM (n = 8 per feeding condition). B, Daily pattern of food intake (expressed as percentage of daily intake during baseline) in light/dark cycle and ad libitum feeding (LD + AL; top row) and during the third week of food restriction under a light/dark cycle (LD + FR; bottom row). Food intake during baseline was determined over 24 h at two 12 h intervals, daytime and nighttime. Food intake during food restriction was measured over 24 h, every 3 h interval from ZT0 to ZT15, and during a 9 h interval from ZT15 to ZT24. During food restriction, the normocalorie-fed group received 100% of daily food intake (i.e., 5.4 g) 6 h after the onset of light, and they ate 60 and 40% of this diet during the afternoon (i.e., from ZT6 to ZT12) and the night (i.e., from ZT12 to ZT24), respectively. The hypocalorie-fed group was given only 66% of baseline food intake (i.e., 3.6 g) at ZT6. This hypocaloric diet was eaten between ZT6 and ZT9. Control mice had ad libitum access to food during the experiment. Statistical analysis of food intake was performed on the cumulated intake during daytime and nighttime. *p < 0.05 in diurnal or nocturnal food intake for a given nutritional status between LD + AL and LD + FR; a,bp < 0.05 in diurnal or nocturnal food intake in hypocalorie-fed or normocalorie-fed mice compared with ad libitum-fed mice and in hypocalorie-fed versus normocalorie-fed mice, respectively. Nighttime is indicated by a black bar on abscissa. Time of hypocaloric and normocaloric feeding is indicated by a vertical arrow 6 h after lights on. Means ± SEM (n = 6 per feeding condition).
Figure 3.
Figure 3.
A, Changes in body mass (expressed as percentage of initial body mass at day 0) in hypocalorie-fed, normocalorie-fed, and ad libitum-fed mice. B, Daily changes of blood glucose in hypocalorie-fed, normocalorie-fed, and ad libitum-fed mice. pZT0 and pZT12 are defined, respectively, as the projected times of lights on and lights off in the previous lighting cycle. Data for pZT0 are double plotted at pZT24. Time of hypocaloric and normocaloric feeding 6 h after lights on is indicated by a vertical arrow.
Figure 4.
Figure 4.
Expression of Per1 at pZT3, Per2 at pZT12, Cry2 at pZT6, Bmal1 at pZT18, and vasopressin (AVP) at pZT3 in the suprachiasmatic nuclei of ad libitum-fed (AL; top row), hypocalorie-fed (HF; middle row), and normocalorie-fed (NF; bottom row) mice. Scale bar, 1 mm.
Figure 5.
Figure 5.
Daily profiles of Per1, Per2, Cry2, Bmal1, and vasopressin (AVP) mRNA levels in the SCN of ad libitum-fed versus normocalorie-fed mice (left column) and of ad libitum-fed versus hypocalorie-fed mice (right column) and respective fitted curves. Means ± SEM (n = 4 per feeding condition at a given time point) and fitted curves. Asterisks indicate a significant phase shift between the two curves. Data for pZT0 are double plotted at pZT24. Nighttime is indicated by a black bar on abscissa. Time of hypocaloric and normocaloric feeding is indicated by a vertical arrow 6 h after lights on. a.u., Arbitrary unit.
Figure 6.
Figure 6.
A, Daily rhythm of pineal melatonin in ad libitum-fed (filled circles; n = 3 per time point) versus hypocalorie-fed (open triangles; n = 4) mice and respective fitted curves. B, Light-induced suppression of plasma melatonin in ad libitum-fed (n = 4 per time point) versus hypocalorie-fed (n = 4) mice. Time of hypocaloric feeding is indicated by a vertical arrow 6 h after lights on. Data for pZT9 are double plotted.
Figure 7.
Figure 7.
Daily wheel-running activity in three ad libitum-fed mice (top row) and three hypocalorie-fed mice (bottom row) exposed to a light pulse (LP) at pZT0 (left column), pZT12 (middle column), and pZT18 (right column). First period (2 weeks) in light/dark cycle and ad libitum feeding (LD + AL); second period (3 weeks) under a light/dark cycle with or without food restriction (LD + FR); and third period (2 weeks) in constant darkness and ad libitum feeding (DD + AL) with a light pulse on the first day of constant darkness. Successive 24 h periods are double plotted (48 h horizontal time scale). Nighttime, when mice were housed under light/dark conditions, is indicated by black bar on top abscissa. Time of feeding during food restriction is indicated by a vertical arrow 6 h after lights on. Light pulse is indicated by circles. AL, Ad libitum feeding; DD, constant darkness; FR, food restriction; LD, light/dark cycle.
Figure 8.
Figure 8.
Phase-response curve of locomotor activity rhythm to light exposure in ad libitum-fed mice (filled circles; n = 4 per time point) and hypocalorie-fed mice (open triangles; n = 5 per time point). Six ad libitum-fed and six hypocalorie-fed mice not exposed to light served as “dark controls.” Data for pZT0 are double plotted at pZT24.
Figure 9.
Figure 9.
Expression of Per1 and Per2 in the suprachiasmatic nuclei of ad libitum-fed (AL) and hypocalorie-fed (HF) mice exposed to a 1 h light pulse (right rows) at pZT18 (Per1) and at pZT15 (Per2) or kept in dark at the same time points (left rows). Scale bar, 1 mm.
Figure 10.
Figure 10.
Altered light-induced expression of Per1 and Per2 in hypocalorie-fed mice (HF; open triangles) compared with control mice fed ad libitum (AL; filled circles). Left column, Data are presented as absolute values in light-exposed animals (n = 4 per time point per feeding condition). Right column, Data of light-exposed animals are presented as percentage of mRNA levels of mice not exposed to light (for each time point, 3 dark controls fed ad libitum and 4 dark controls previously fed with hypocaloric diet). Time of feeding during food restriction is indicated by a vertical arrow 6 h after lights on. a.u., Arbitrary unit. Data for pZT0 are double plotted at pZT24. The effect of feeding condition (AL vs HF) for Per1 and Per2 in light-exposed animals was significant at p < 0.001 and p < 0.05, respectively, whereas the interaction between feeding condition and time was not significant in both cases. *p < 0.05 according to feeding conditions for a given time point.

Similar articles

Cited by

References

    1. Abe H, Honma S, Namihira M, Tanahashi Y, Ikeda M, Honma KI (1998) Circadian rhythm and light responsiveness of BMAL1 expression, a partner of mammalian clock gene Clock, in the suprachiasmatic nucleus of rats. Neurosci Lett 258: 93-96. - PubMed
    1. Albrecht U, Sun ZS, Eichele G, Lee CC (1997) A differential response of two putative mammalian circadian regulators, mPer1 and mPer2, to light. Cell 91: 1055-1064. - PubMed
    1. Albrecht U, Zheng B, Larkin D, Sun ZS, Lee CC (2001) mPer1 and mPer2 are essential for normal resetting of the circadian clock. J Biol Rhythms 16: 100-104. - PubMed
    1. Challet E, Pevet P (2003) Interactions between photic and nonphotic stimuli to synchronize the master circadian clock in mammals. Front Biosci 8: s246-s257. - PubMed
    1. Challet E, Pevet P, Vivien-Roels B, Malan A (1997) Phase-advanced daily rhythms of melatonin, body temperature, and locomotor activity in food-restricted rats fed during daytime. J Biol Rhythms 12: 65-79. - PubMed

Publication types

MeSH terms

LinkOut - more resources