

Enhanced temporal response properties of anteroventral cochlear nucleus neurons to broadband noise
- PMID: 15703410
- PMCID: PMC6725990
- DOI: 10.1523/JNEUROSCI.4742-04.2005
Enhanced temporal response properties of anteroventral cochlear nucleus neurons to broadband noise
Abstract
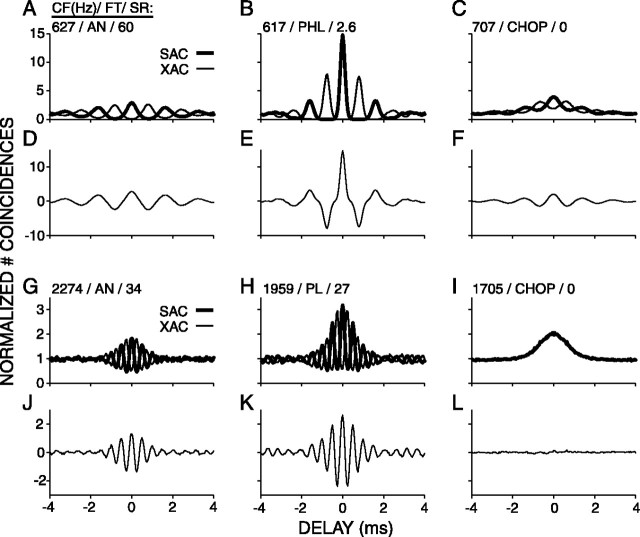
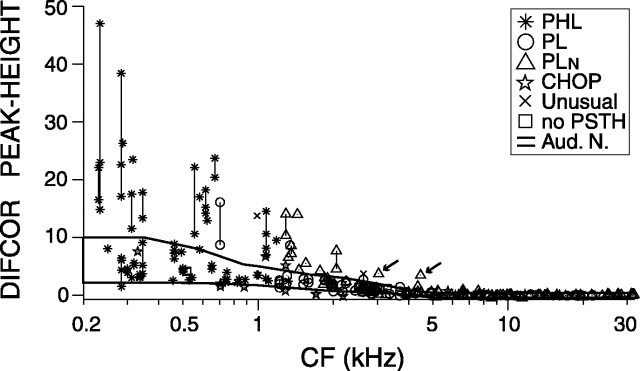
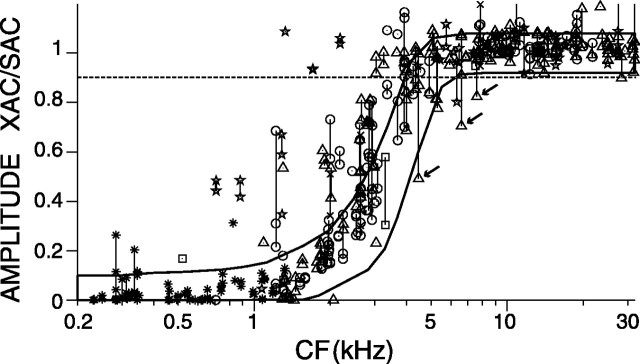
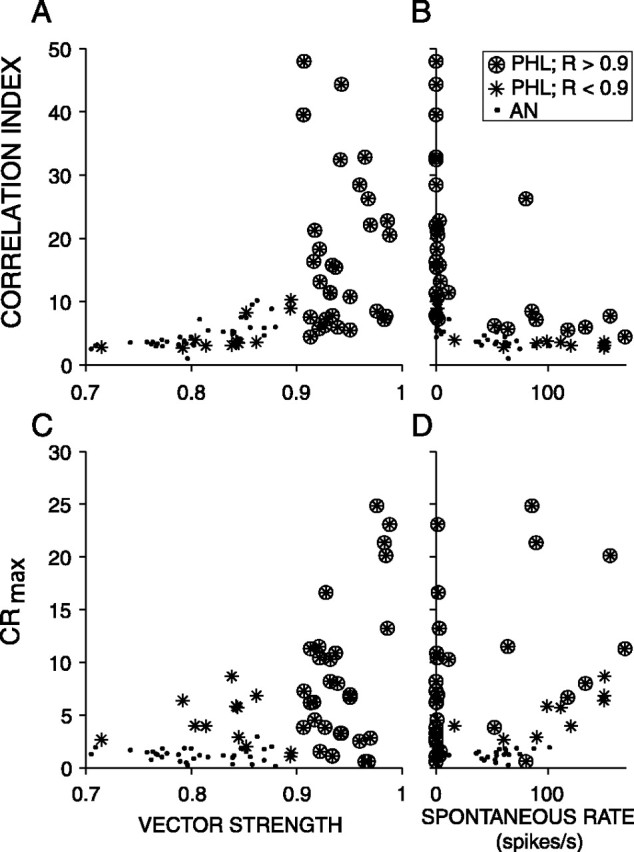
Compared with auditory nerve (AN) fibers, trapezoid body (TB) fibers of the cat show enhanced synchronization to low-frequency tones. This phenomenon probably contributes to the high temporal resolution of binaural processing. We examined whether enhanced synchronization also occurs to sustained broadband noise. We recorded responses to a reference Gaussian noise and its polarity-inverted version in the TB of barbiturate-anesthetized cats. From these we constructed shuffled autocorrelograms (SACs) and quantified spike timing by measuring the amplitude and width of their central peak. Many TB fibers with low characteristic frequency (CF) showed SACs with higher and narrower central peaks than ever observed in the AN, indicating better consistency and precision of temporal coding. Larger peaks were also observed in TB fibers with high CF, but this was mostly caused by higher average firing rates, resulting in a larger number of coincident spikes across stimulus repetitions. The results document monaural preprocessing of the temporal information delivered to binaural nuclei in the olivary complex, which likely contributes to the high sensitivity to interaural time differences.
Figures

Similar articles
-
Responses of auditory nerve and anteroventral cochlear nucleus fibers to broadband and narrowband noise: implications for the sensitivity to interaural delays.J Assoc Res Otolaryngol. 2011 Aug;12(4):485-502. doi: 10.1007/s10162-011-0268-1. Epub 2011 May 13. J Assoc Res Otolaryngol. 2011. PMID: 21567250 Free PMC article.
-
Temporal properties of responses to broadband noise in the auditory nerve.J Neurophysiol. 2004 May;91(5):2051-65. doi: 10.1152/jn.00816.2003. J Neurophysiol. 2004. PMID: 15069097
-
Enhancement of neural synchronization in the anteroventral cochlear nucleus. I. Responses to tones at the characteristic frequency.J Neurophysiol. 1994 Mar;71(3):1022-36. doi: 10.1152/jn.1994.71.3.1022. J Neurophysiol. 1994. PMID: 8201399
-
Envelope coding in the lateral superior olive. III. Comparison with afferent pathways.J Neurophysiol. 1998 Jan;79(1):253-69. doi: 10.1152/jn.1998.79.1.253. J Neurophysiol. 1998. PMID: 9425196
-
Response properties of cochlear efferent neurons: monaural vs. binaural stimulation and the effects of noise.J Neurophysiol. 1988 Nov;60(5):1779-98. doi: 10.1152/jn.1988.60.5.1779. J Neurophysiol. 1988. PMID: 3199181
Cited by
-
Axonal recordings from medial superior olive neurons obtained from the lateral lemniscus of the chinchilla (Chinchilla laniger).J Neurosci. 2013 Oct 30;33(44):17506-18. doi: 10.1523/JNEUROSCI.1518-13.2013. J Neurosci. 2013. PMID: 24174683 Free PMC article.
-
Responses of auditory nerve and anteroventral cochlear nucleus fibers to broadband and narrowband noise: implications for the sensitivity to interaural delays.J Assoc Res Otolaryngol. 2011 Aug;12(4):485-502. doi: 10.1007/s10162-011-0268-1. Epub 2011 May 13. J Assoc Res Otolaryngol. 2011. PMID: 21567250 Free PMC article.
-
Ambiguous pitch and the temporal representation of inharmonic iterated rippled noise in the ventral cochlear nucleus.J Neurosci. 2008 Nov 12;28(46):11925-38. doi: 10.1523/JNEUROSCI.3137-08.2008. J Neurosci. 2008. PMID: 19005058 Free PMC article.
-
Predicting spike timing in highly synchronous auditory neurons at different sound levels.J Neurophysiol. 2013 Oct;110(7):1672-88. doi: 10.1152/jn.00051.2013. Epub 2013 Jul 17. J Neurophysiol. 2013. PMID: 23864375 Free PMC article.
-
Auditory midbrain and nerve responses to sinusoidal variations in interaural correlation.J Neurosci. 2006 Jan 4;26(1):279-89. doi: 10.1523/JNEUROSCI.2285-05.2006. J Neurosci. 2006. PMID: 16399698 Free PMC article.
References
-
- Batra R, Kuwada S, Fitzpatrick DC (1997) Sensitivity to interaural temporal disparities of low- and high-frequency neurons in the superior olivary complex. I. Heterogeneity of responses. J Neurophysiol 78: 1222-1236. - PubMed
-
- Blackburn CC, Sachs MB (1989) Classification of unit types in the anteroventral cochlear nucleus: PST histograms and regularity analysis. J Neurophysiol 62: 1303-1329. - PubMed
-
- Blackburn CC, Sachs MB (1990) The representations of the steady-state vowel sound /ϵ/ in the discharge patterns of cat anteroventral cochlear nucleus neurons. J Neurophysiol 63: 1191-1212. - PubMed
-
- Bourk TR (1976) Electrical responses of neural units in the anteroventral cochlear nucleus of the cat. Cambridge, MA: MIT.
-
- Brownell WE (1975) Organization of the cat trapezoid body and the discharge characteristics of its fibers. Brain Res 94: 413-433. - PubMed
Publication types
MeSH terms
Substances
LinkOut - more resources
Full Text Sources
Medical
Miscellaneous